29
/pt/
pt
AIzaSyAYiBZKx7MnpbEhh9jyipgxe19OcubqV5w
April 1, 2024
36184
High income
HIC
false
2
1
Services, etc., value added (% of GDP)
2015,2014,2013,2012,2011,2010,2009,2008,2007,2006,2005,2004,2003,2002,2001,2000,1999,1998
Download
Biblioteca de estatísticas globais →High income →

Services, etc., value added (% of GDP)

Estas estatísticas em outros países:
AfghanistanAlbaniaAlgeriaAndorraAngolaAntigua and BarbudaArab WorldArgentinaArmeniaArubaAustraliaAustriaAzerbaijanBahamas, TheBahrainBangladeshBarbadosBelarusBelgiumBelizeBeninBermudaBhutanBoliviaBosnia and HerzegovinaBotswanaBrazilBrunei DarussalamBulgariaBurkina FasoBurundiCabo VerdeCambodiaCameroonCanadaCaribbean small statesCentral African RepublicCentral Europe and the BalticsChadChileChinaColombiaComorosCongo, Dem. Rep.Congo, Rep.Costa RicaCote d'IvoireCroatiaCubaCyprusCzech RepublicDenmarkDjiboutiDominicaDominican RepublicEarly-demographic dividendEast Asia & PacificEast Asia & Pacific (excluding high income)East Asia & Pacific (IDA & IBRD countries)EcuadorEgypt, Arab Rep.El SalvadorEquatorial GuineaEritreaEstoniaEthiopiaEuro areaEurope & Central AsiaEurope & Central Asia (excluding high income)Europe & Central Asia (IDA & IBRD countries)European UnionFaroe IslandsFijiFinlandFragile and conflict affected situationsFranceGabonGambia, TheGeorgiaGermanyGhanaGreeceGrenadaGuatemalaGuineaGuinea-BissauGuyanaHeavily indebted poor countries (HIPC)High incomeHondurasHong Kong SAR, ChinaHungaryIBRD onlyIcelandIDA & IBRD totalIDA blendIDA onlyIDA totalIndiaIndonesiaIran, Islamic Rep.IrelandItalyJamaicaJapanJordanKazakhstanKenyaKiribatiKorea, Rep.KosovoKuwaitKyrgyz RepublicLao PDRLate-demographic dividendLatin America & Caribbean Latin America & Caribbean (excluding high income)Latin America & the Caribbean (IDA & IBRD countries)LatviaLeast developed countries: UN classificationLebanonLesothoLibyaLithuaniaLow & middle incomeLow incomeLower middle incomeLuxembourgMacao SAR, ChinaMacedonia, FYRMadagascarMalawiMalaysiaMaldivesMaliMaltaMarshall IslandsMauritaniaMauritiusMexicoMicronesia, Fed. Sts.Middle East & North AfricaMiddle East & North Africa (excluding high income)Middle East & North Africa (IDA & IBRD countries)Middle incomeMoldovaMongoliaMontenegroMoroccoMozambiqueMyanmarNamibiaNepalNetherlandsNew CaledoniaNew ZealandNicaraguaNigerNigeriaNorth AmericaNorwayOECD membersOmanOther small statesPacific island small statesPakistanPalauPanamaPapua New GuineaParaguayPeruPhilippinesPolandPortugalPost-demographic dividendPre-demographic dividendPuerto RicoQatarRomaniaRussian FederationRwandaSao Tome and PrincipeSaudi ArabiaSenegalSerbiaSeychellesSierra LeoneSingaporeSlovak RepublicSloveniaSmall statesSolomon IslandsSomaliaSouth AfricaSouth AsiaSouth Asia (IDA & IBRD)SpainSri LankaSt. Kitts and NevisSt. LuciaSt. Vincent and the GrenadinesSub-Saharan Africa Sub-Saharan Africa (excluding high income)Sub-Saharan Africa (IDA & IBRD countries)SudanSurinameSwazilandSwedenSwitzerlandSyrian Arab RepublicTajikistanTanzaniaThailandTimor-LesteTogoTongaTrinidad and TobagoTunisiaTurkeyTurkmenistanTuvaluUgandaUkraineUnited KingdomUnited StatesUpper middle incomeUruguayUzbekistanVanuatuVenezuela, RBVietnamWest Bank and GazaWorldYemen, Rep.ZambiaZimbabwe
Linha do tempo:
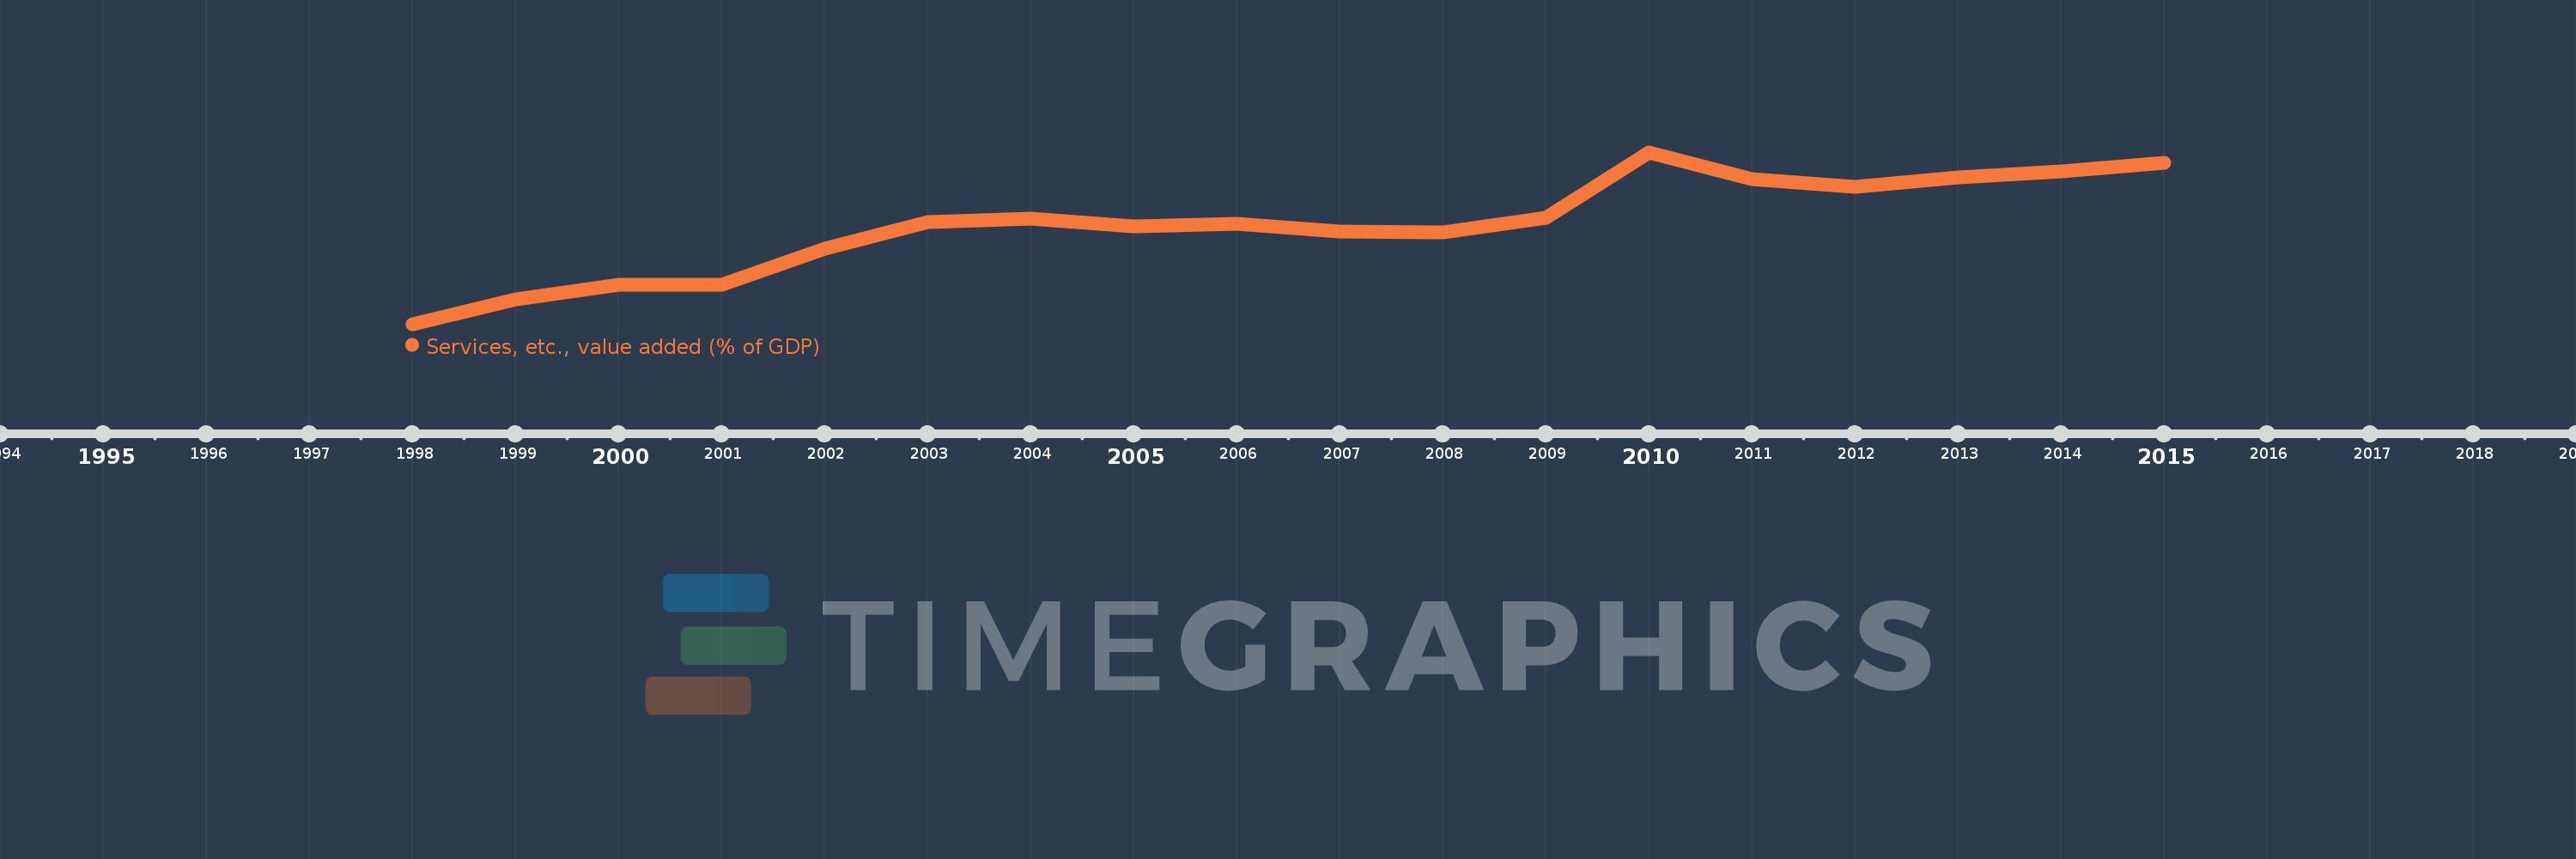
Nesta escala de tempo está apresentado um gráfico de 1998 ano até 2015 ano High income. Dados de 1997 ano ausente. O número de observações reais por data: 18.
Fonte (nome):
Indicadores de desenvolvimento mundial
Fonte (organização):
World Bank national accounts data, and OECD National Accounts data files.
Categorias:
Economy & Growth
Foi atualizado:
23 abr 2017 ano
Indicadores de alterações dos valores ao longo dos anos
Em média:
72.205
Mínimo:
69.567
1 jan 1998 ano
Máximo:
74.12
1 jan 2010 ano
Na data de observação
Valor
Mudança absoluta
A alteração em relação ao valor anterior
1 jan 1998 ano
69.567
+69.567
0.0%
1 jan 1999 ano
70.215
+0.648
0.93%
1 jan 2000 ano
70.617
+0.402
0.57%
1 jan 2001 ano
70.611
-0.006
-0.01%
1 jan 2002 ano
71.562
+0.951
1.35%
1 jan 2003 ano
72.273
+0.711
0.99%
1 jan 2004 ano
72.362
+0.089
0.12%
1 jan 2005 ano
72.168
-0.194
-0.27%
1 jan 2006 ano
72.223
+0.055
0.08%
1 jan 2007 ano
72.021
-0.202
-0.28%
1 jan 2008 ano
71.994
-0.027
-0.04%
1 jan 2009 ano
72.389
+0.395
0.55%
1 jan 2010 ano
74.12
+1.731
2.39%
1 jan 2011 ano
73.418
-0.702
-0.95%
1 jan 2012 ano
73.212
-0.206
-0.28%
1 jan 2013 ano
73.467
+0.255
0.35%
1 jan 2014 ano
73.627
+0.159
0.22%
1 jan 2015 ano
73.845
+0.218
0.3%
Classificação de países por estatísticas atuais por anos

Comentários:

Enviar
PremiumAbout & FeedbackAcordoPrivacidade
logo
© 2022 Selected Technologies LLC – Morgan Hill, California