33
/pt/
AIzaSyAYiBZKx7MnpbEhh9jyipgxe19OcubqV5w
August 1, 2025
35537
High income
HIC
false
2
1
All education staff compensation, primary (% of total expenditure in primary public institutions)
2013,2012,2011,2010,2009,2008,2007,2006,2005,2004,2003,2002,2000
Download
Biblioteca de estatísticas globais →High income →

All education staff compensation, primary (% of total expenditure in primary public institutions)

Estas estatísticas em outros países:

AlgeriaAndorraAngolaAntigua and BarbudaArgentinaArmeniaArubaAustraliaAustriaBahrainBangladeshBarbadosBelarusBelgiumBelizeBeninBhutanBoliviaBotswanaBrazilBritish Virgin IslandsBulgariaBurkina FasoBurundiCabo VerdeCambodiaCameroonCanadaCaribbean small statesCayman IslandsCentral African RepublicCentral Europe and the BalticsChadChileChinaColombiaComorosCongo, Dem. Rep.Congo, Rep.Costa RicaCote d'IvoireCubaCuracaoCyprusCzech RepublicDenmarkDjiboutiDominicaDominican RepublicEast Asia & Pacific (IDA & IBRD countries)EcuadorEl SalvadorEritreaEstoniaEthiopiaEuro areaEurope & Central AsiaEuropean UnionFinlandFranceGambia, TheGermanyGhanaGuatemalaGuineaGuinea-BissauGuyanaHeavily indebted poor countries (HIPC)High incomeHondurasHungaryIcelandIDA blendIndiaIndonesiaIrelandIsraelItalyJamaicaJapanJordanKazakhstanKorea, Rep.KuwaitLate-demographic dividendLatin America & Caribbean Latin America & Caribbean (excluding high income)Latin America & the Caribbean (IDA & IBRD countries)LatviaLebanonLesothoLiechtensteinLithuaniaLow incomeLuxembourgMacao SAR, ChinaMadagascarMalawiMalaysiaMaliMaltaMarshall IslandsMauritaniaMauritiusMexicoMoldovaMonacoMongoliaMoroccoMozambiqueNamibiaNetherlandsNicaraguaNigerNorth AmericaNorwayOECD membersOmanPanamaParaguayPeruPhilippinesPolandPortugalPost-demographic dividendPuerto RicoRomaniaRwandaSan MarinoSao Tome and PrincipeSerbiaSeychellesSierra LeoneSlovak RepublicSloveniaSouth AfricaSpainSri LankaSt. Kitts and NevisSt. LuciaSt. Vincent and the GrenadinesSub-Saharan Africa Sub-Saharan Africa (excluding high income)Sub-Saharan Africa (IDA & IBRD countries)SwedenSwitzerlandSyrian Arab RepublicThailandTimor-LesteTogoTunisiaTurkeyTurks and Caicos IslandsUgandaUnited Arab EmiratesUnited KingdomUnited StatesUruguayVanuatuVenezuela, RBVietnamYemen, Rep.Zambia

Linha do tempo:

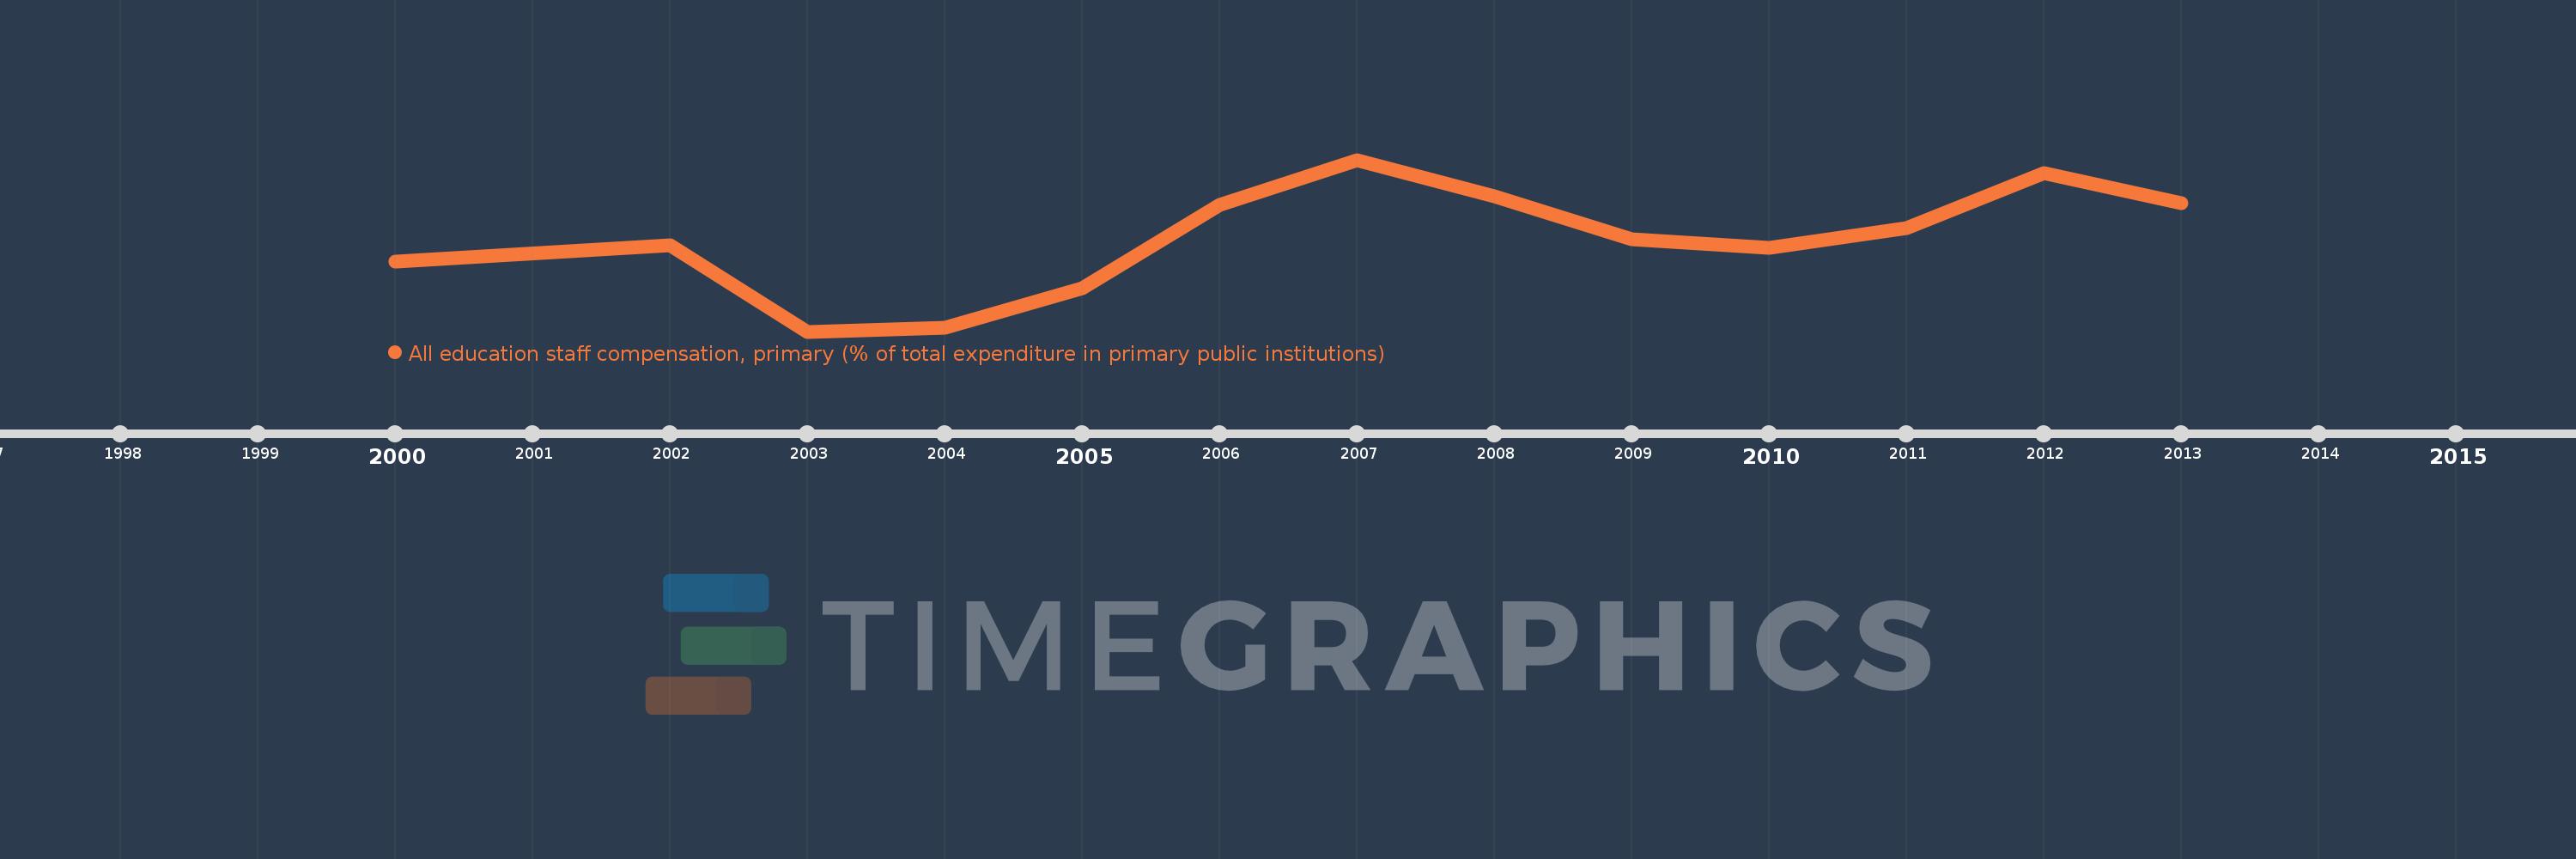
Nesta escala de tempo está apresentado um gráfico de 2000 ano até 2013 ano High income. Dados de 1999 ano ausente. O número de observações reais por data: 13.

Fonte (nome):

Indicadores de desenvolvimento mundial

Fonte (organização):

United Nations Educational, Scientific, and Cultural Organization (UNESCO) Institute for Statistics.

Categorias:

Education

Foi atualizado:

23 abr 2017 ano

Indicadores de alterações dos valores ao longo dos anos

Em média:
73.361
Mínimo:
71.219
1 jan 2003 ano
Máximo:
75.19
1 jan 2007 ano
Na data de observação
Valor
Mudança absoluta
A alteração em relação ao valor anterior
1 jan 2000 ano
72.829
+72.829
0.0%
1 jan 2002 ano
73.221
+0.391
0.54%
1 jan 2003 ano
71.219
-2.002
-2.73%
1 jan 2004 ano
71.31
+0.091
0.13%
1 jan 2005 ano
72.228
+0.918
1.29%
1 jan 2006 ano
74.144
+1.916
2.65%
1 jan 2007 ano
75.19
+1.045
1.41%
1 jan 2008 ano
74.354
-0.836
-1.11%
1 jan 2009 ano
73.345
-1.009
-1.36%
1 jan 2010 ano
73.163
-0.181
-0.25%
1 jan 2011 ano
73.616
+0.453
0.62%
1 jan 2012 ano
74.873
+1.257
1.71%
1 jan 2013 ano
74.195
-0.678
-0.91%

Classificação de países por estatísticas atuais por anos