33
/pt/
AIzaSyB4mHJ5NPEv-XzF7P6NDYXjlkCWaeKw5bc
November 1, 2025
34015
Fragile and conflict affected situations
FCS
false
2
1
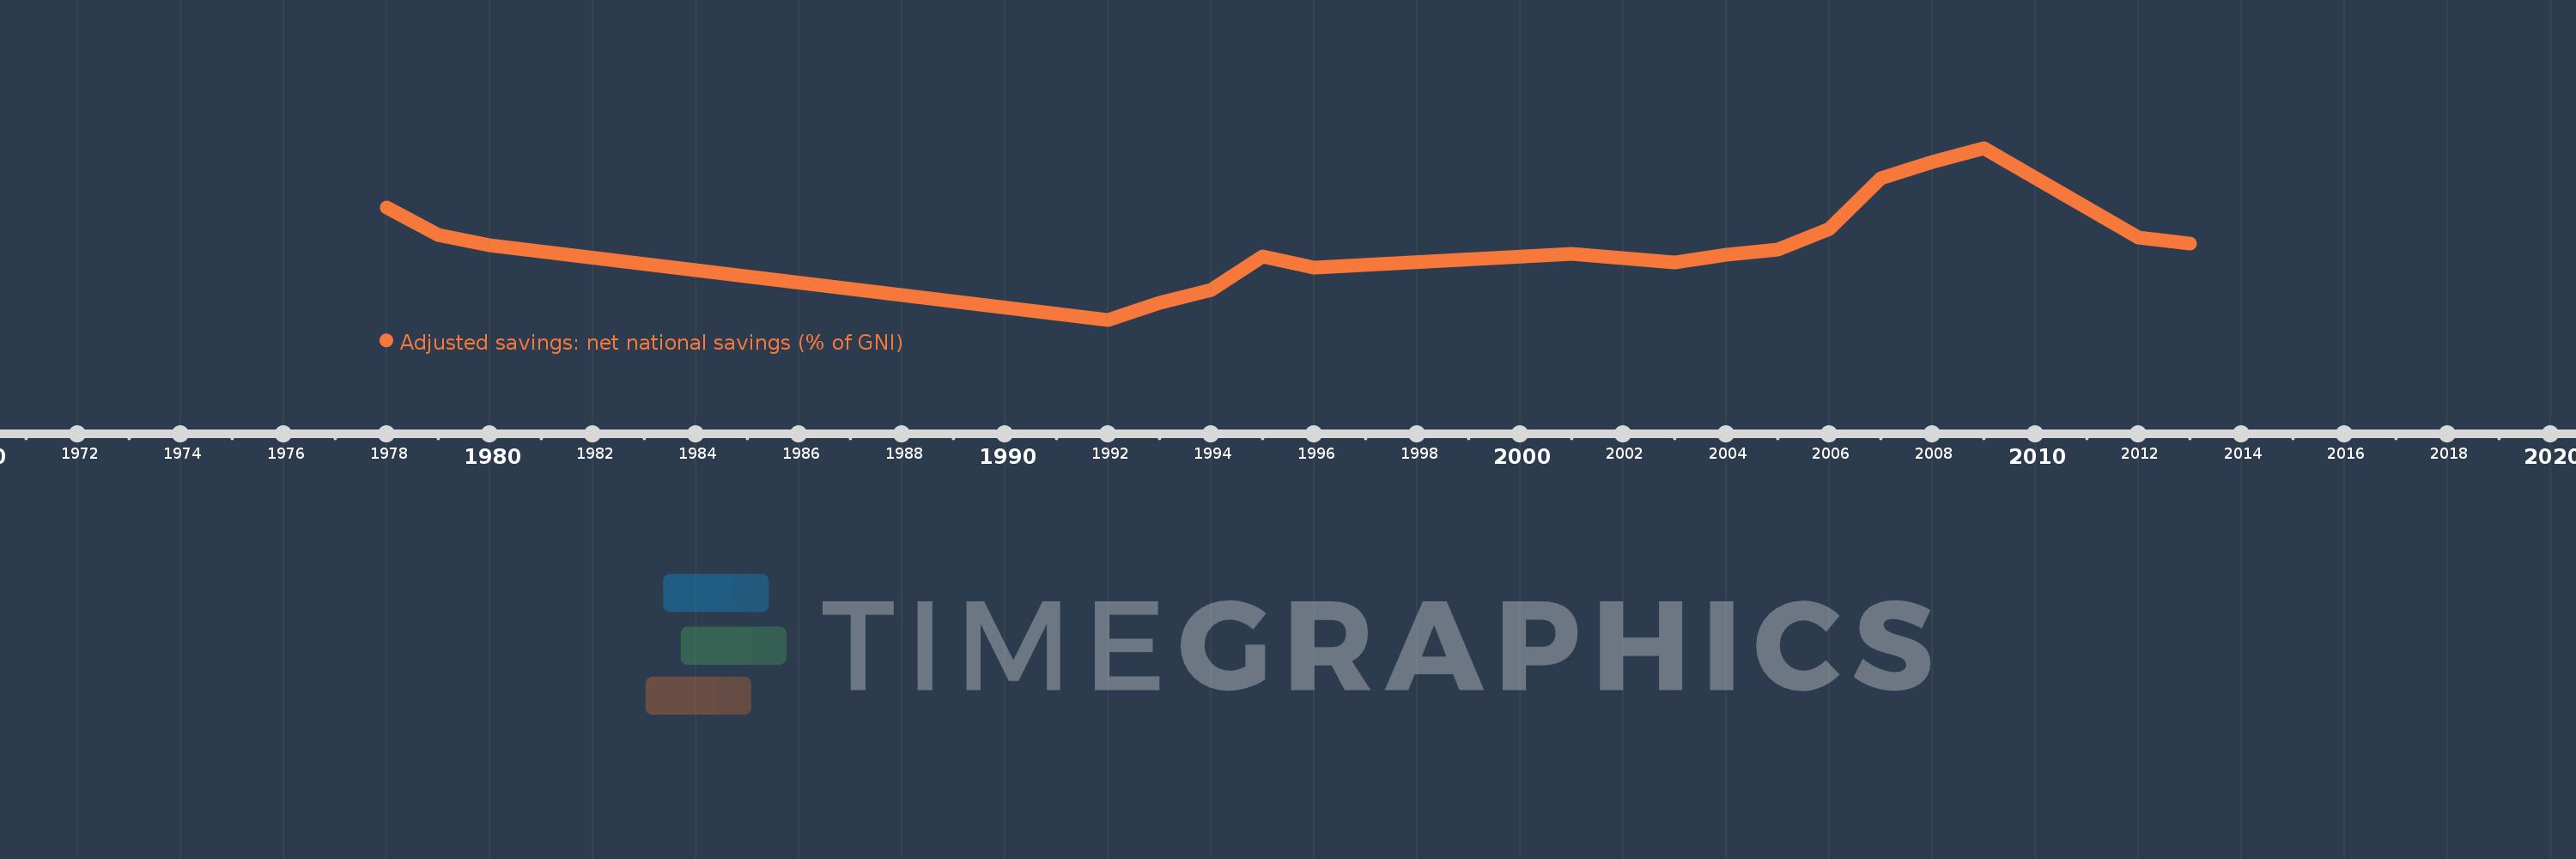
Adjusted savings: net national savings (% of GNI)
2013,2012,2009,2008,2007,2006,2005,2004,2003,2001,1996,1995,1994,1993,1992,1980,1979,1978