33
/pt/
AIzaSyAYiBZKx7MnpbEhh9jyipgxe19OcubqV5w
August 1, 2025
31761
Europe & Central Asia (excluding high income)
ECA
false
2
1
Labor force with tertiary education, female (% of female labor force)
2014,2013,2012,2011,2010,2008,2005,2003
Download
Biblioteca de estatísticas globais →Europe & Central Asia (excluding high income) →

Labor force with tertiary education, female (% of female labor force)

Estas estatísticas em outros países:

AlbaniaAlgeriaAntigua and BarbudaArgentinaArmeniaArubaAustraliaAustriaAzerbaijanBahamas, TheBahrainBarbadosBelarusBelgiumBelizeBermudaBoliviaBosnia and HerzegovinaBotswanaBrazilBritish Virgin IslandsBulgariaCanadaCayman IslandsCentral Europe and the BalticsChadChileColombiaCosta RicaCroatiaCubaCyprusCzech RepublicDenmarkDominicaDominican RepublicEarly-demographic dividendEcuadorEgypt, Arab Rep.El SalvadorEstoniaEthiopiaEuro areaEurope & Central AsiaEurope & Central Asia (excluding high income)Europe & Central Asia (IDA & IBRD countries)European UnionFinlandFranceGeorgiaGermanyGhanaGreeceGuatemalaGuyanaHigh incomeHondurasHong Kong SAR, ChinaHungaryIcelandIndiaIndonesiaIran, Islamic Rep.IrelandIsraelItalyJapanJordanKazakhstanKorea, Rep.KuwaitKyrgyz RepublicLatin America & Caribbean Latin America & Caribbean (excluding high income)Latin America & the Caribbean (IDA & IBRD countries)LatviaLebanonLithuaniaLuxembourgMacao SAR, ChinaMacedonia, FYRMadagascarMalaysiaMaltaMauritiusMexicoMoldovaMongoliaMontenegroMoroccoNamibiaNepalNetherlandsNew ZealandNicaraguaNigerNigeriaNorth AmericaNorwayOECD membersOmanPakistanPanamaParaguayPeruPhilippinesPolandPortugalPost-demographic dividendRomaniaRussian FederationRwandaSan MarinoSaudi ArabiaSerbiaSingaporeSlovak RepublicSloveniaSouth AfricaSouth AsiaSouth Asia (IDA & IBRD)SpainSri LankaSt. Kitts and NevisSt. LuciaSt. Vincent and the GrenadinesSwedenSwitzerlandSyrian Arab RepublicTajikistanThailandTimor-LesteTrinidad and TobagoTunisiaTurkeyUgandaUkraineUnited Arab EmiratesUnited KingdomUnited StatesUruguayVenezuela, RBWest Bank and GazaYemen, Rep.

Linha do tempo:

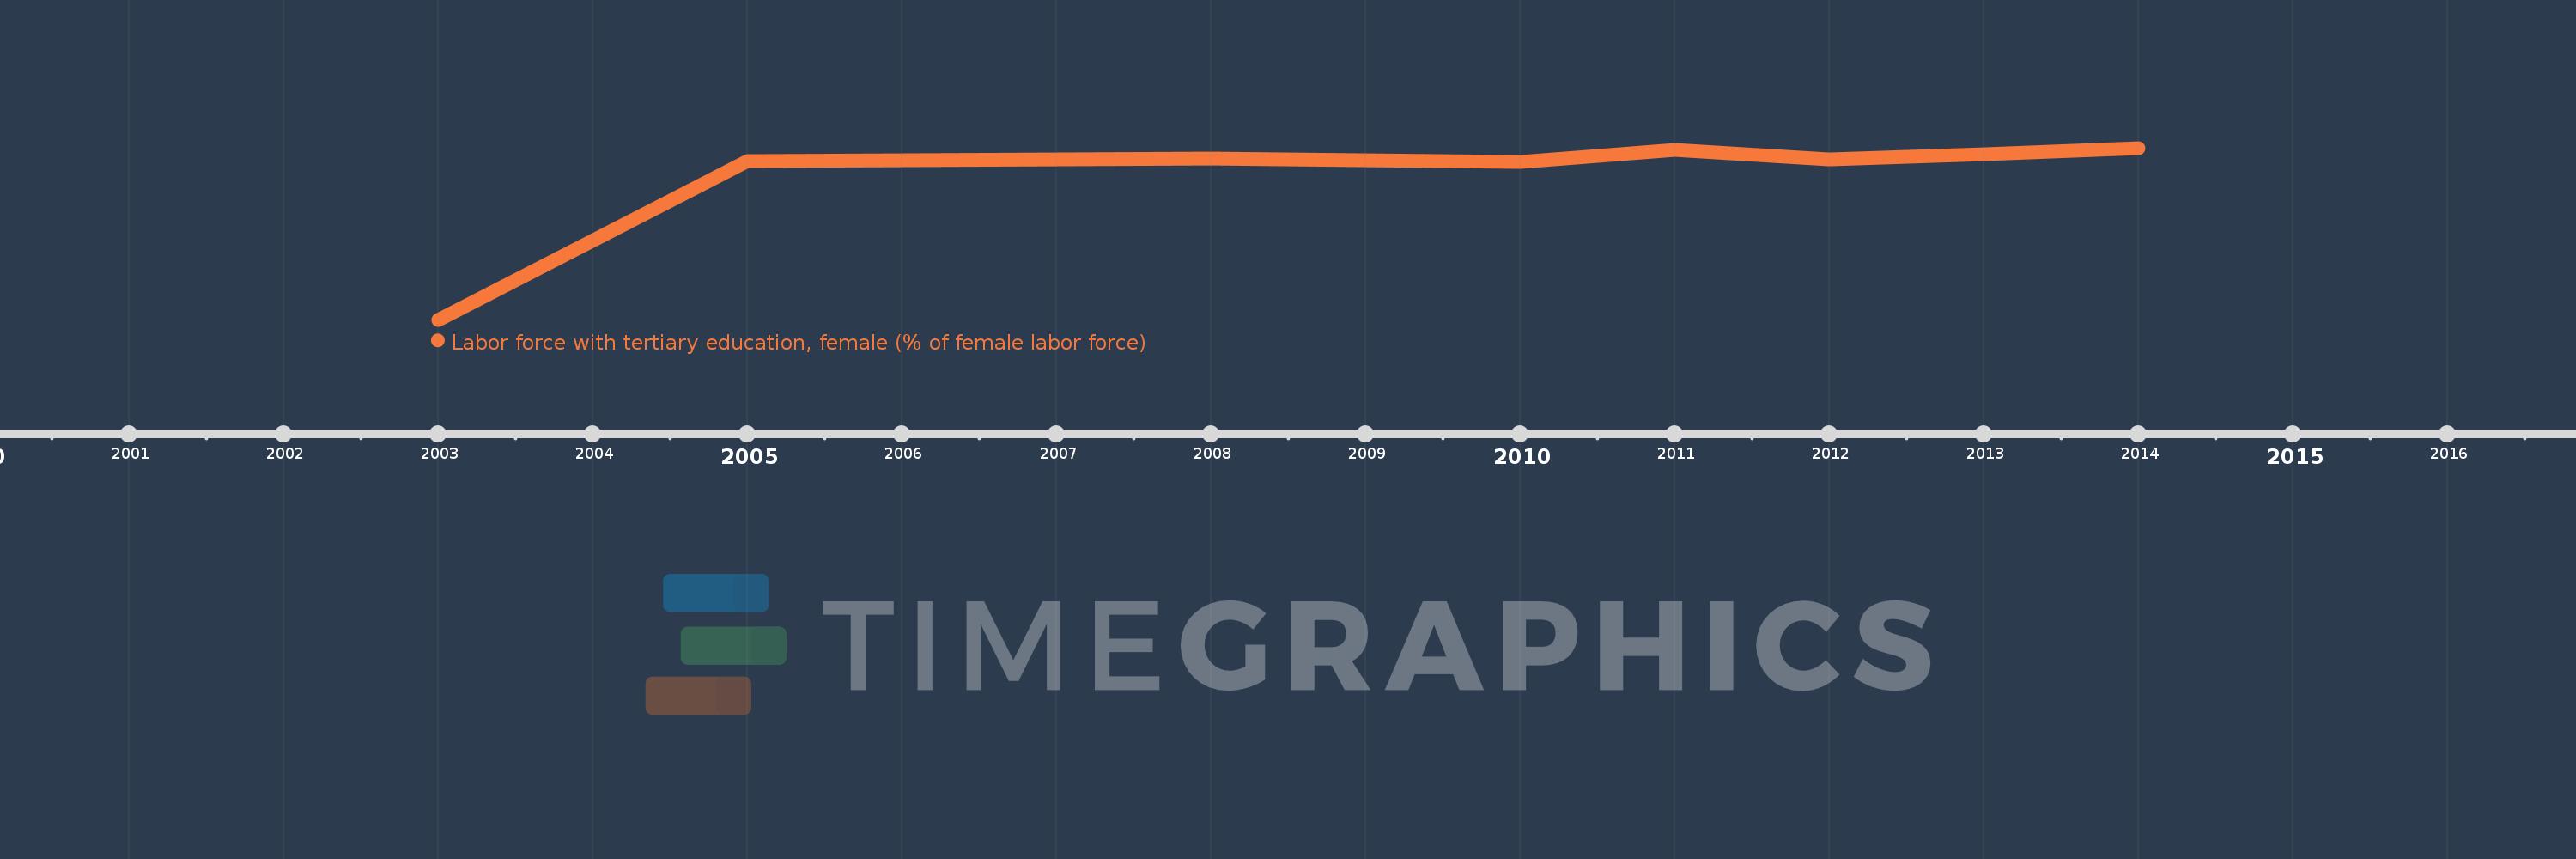
Nesta escala de tempo está apresentado um gráfico de 2003 ano até 2014 ano Europe & Central Asia (excluding high income). Dados de 2002 ano ausente. O número de observações reais por data: 8.

Fonte (nome):

Indicadores de desenvolvimento mundial

Fonte (organização):

International Labour Organization, Key Indicators of the Labour Market database.

Categorias:

Education, Social Protection & Labor, Gender

Foi atualizado:

23 abr 2017 ano

Indicadores de alterações dos valores ao longo dos anos

Em média:
45.208
Mínimo:
25.958
1 jan 2003 ano
Máximo:
49.051
1 jan 2014 ano
Na data de observação
Valor
Mudança absoluta
A alteração em relação ao valor anterior
1 jan 2003 ano
25.958
+25.958
0.0%
1 jan 2005 ano
47.331
+21.373
82.34%
1 jan 2008 ano
47.641
+0.311
0.66%
1 jan 2010 ano
47.157
-0.485
-1.02%
1 jan 2011 ano
48.794
+1.638
3.47%
1 jan 2012 ano
47.501
-1.293
-2.65%
1 jan 2013 ano
48.23
+0.729
1.53%
1 jan 2014 ano
49.051
+0.822
1.7%

Classificação de países por estatísticas atuais por anos