29
/pt/
pt
AIzaSyAYiBZKx7MnpbEhh9jyipgxe19OcubqV5w
April 1, 2024
282946
Vietnam
VNM
true
2
1
Ratio of female to male labor force participation rate (%) (national estimate)
2015,2014,2013,2012,2011,2010,2008,2005,2004,2003,2002,2001,2000,1999,1998,1997,1990
Download
Biblioteca de estatísticas globais →Vietnam →

Ratio of female to male labor force participation rate (%) (national estimate)

Estas estatísticas em outros países:
AfghanistanAlbaniaAlgeriaAmerican SamoaAntigua and BarbudaArab WorldArgentinaArmeniaArubaAustraliaAustriaAzerbaijanBahamas, TheBahrainBangladeshBarbadosBelarusBelgiumBelizeBeninBermudaBhutanBoliviaBosnia and HerzegovinaBotswanaBrazilBritish Virgin IslandsBrunei DarussalamBulgariaBurkina FasoBurundiCabo VerdeCambodiaCameroonCanadaCaribbean small statesCayman IslandsCentral African RepublicCentral Europe and the BalticsChadChileColombiaComorosCongo, Dem. Rep.Congo, Rep.Costa RicaCote d'IvoireCroatiaCubaCyprusCzech RepublicDenmarkDjiboutiDominicaDominican RepublicEarly-demographic dividendEcuadorEgypt, Arab Rep.El SalvadorEquatorial GuineaEstoniaEthiopiaEuro areaEurope & Central AsiaEurope & Central Asia (excluding high income)Europe & Central Asia (IDA & IBRD countries)European UnionFaroe IslandsFijiFinlandFranceFrench PolynesiaGabonGambia, TheGeorgiaGermanyGhanaGibraltarGreeceGrenadaGuamGuatemalaGuineaGuyanaHaitiHigh incomeHondurasHong Kong SAR, ChinaHungaryIBRD onlyIcelandIDA blendIndiaIndonesiaIran, Islamic Rep.IraqIrelandIsle of ManIsraelItalyJamaicaJapanJordanKazakhstanKenyaKiribatiKorea, Rep.KosovoKuwaitKyrgyz RepublicLao PDRLatin America & Caribbean Latin America & Caribbean (excluding high income)Latin America & the Caribbean (IDA & IBRD countries)LatviaLebanonLesothoLiberiaLibyaLiechtensteinLithuaniaLower middle incomeLuxembourgMacao SAR, ChinaMacedonia, FYRMadagascarMalawiMalaysiaMaldivesMaliMaltaMarshall IslandsMauritaniaMauritiusMexicoMiddle East & North AfricaMiddle East & North Africa (excluding high income)Middle East & North Africa (IDA & IBRD countries)MoldovaMonacoMongoliaMontenegroMoroccoMozambiqueMyanmarNamibiaNauruNepalNetherlandsNew CaledoniaNew ZealandNicaraguaNigerNigeriaNorth AmericaNorthern Mariana IslandsNorwayOECD membersOmanPakistanPalauPanamaPapua New GuineaParaguayPeruPhilippinesPolandPortugalPost-demographic dividendPuerto RicoQatarRomaniaRussian FederationRwandaSamoaSan MarinoSao Tome and PrincipeSaudi ArabiaSenegalSerbiaSeychellesSierra LeoneSingaporeSlovak RepublicSloveniaSolomon IslandsSouth AfricaSouth AsiaSouth Asia (IDA & IBRD)South SudanSpainSri LankaSt. Kitts and NevisSt. LuciaSt. Vincent and the GrenadinesSudanSurinameSwazilandSwedenSwitzerlandSyrian Arab RepublicTajikistanTanzaniaThailandTimor-LesteTogoTongaTrinidad and TobagoTunisiaTurkeyTurks and Caicos IslandsTuvaluUgandaUkraineUnited Arab EmiratesUnited KingdomUnited StatesUruguayVanuatuVenezuela, RBVietnamVirgin Islands (U.S.)West Bank and GazaYemen, Rep.ZambiaZimbabwe
Linha do tempo:
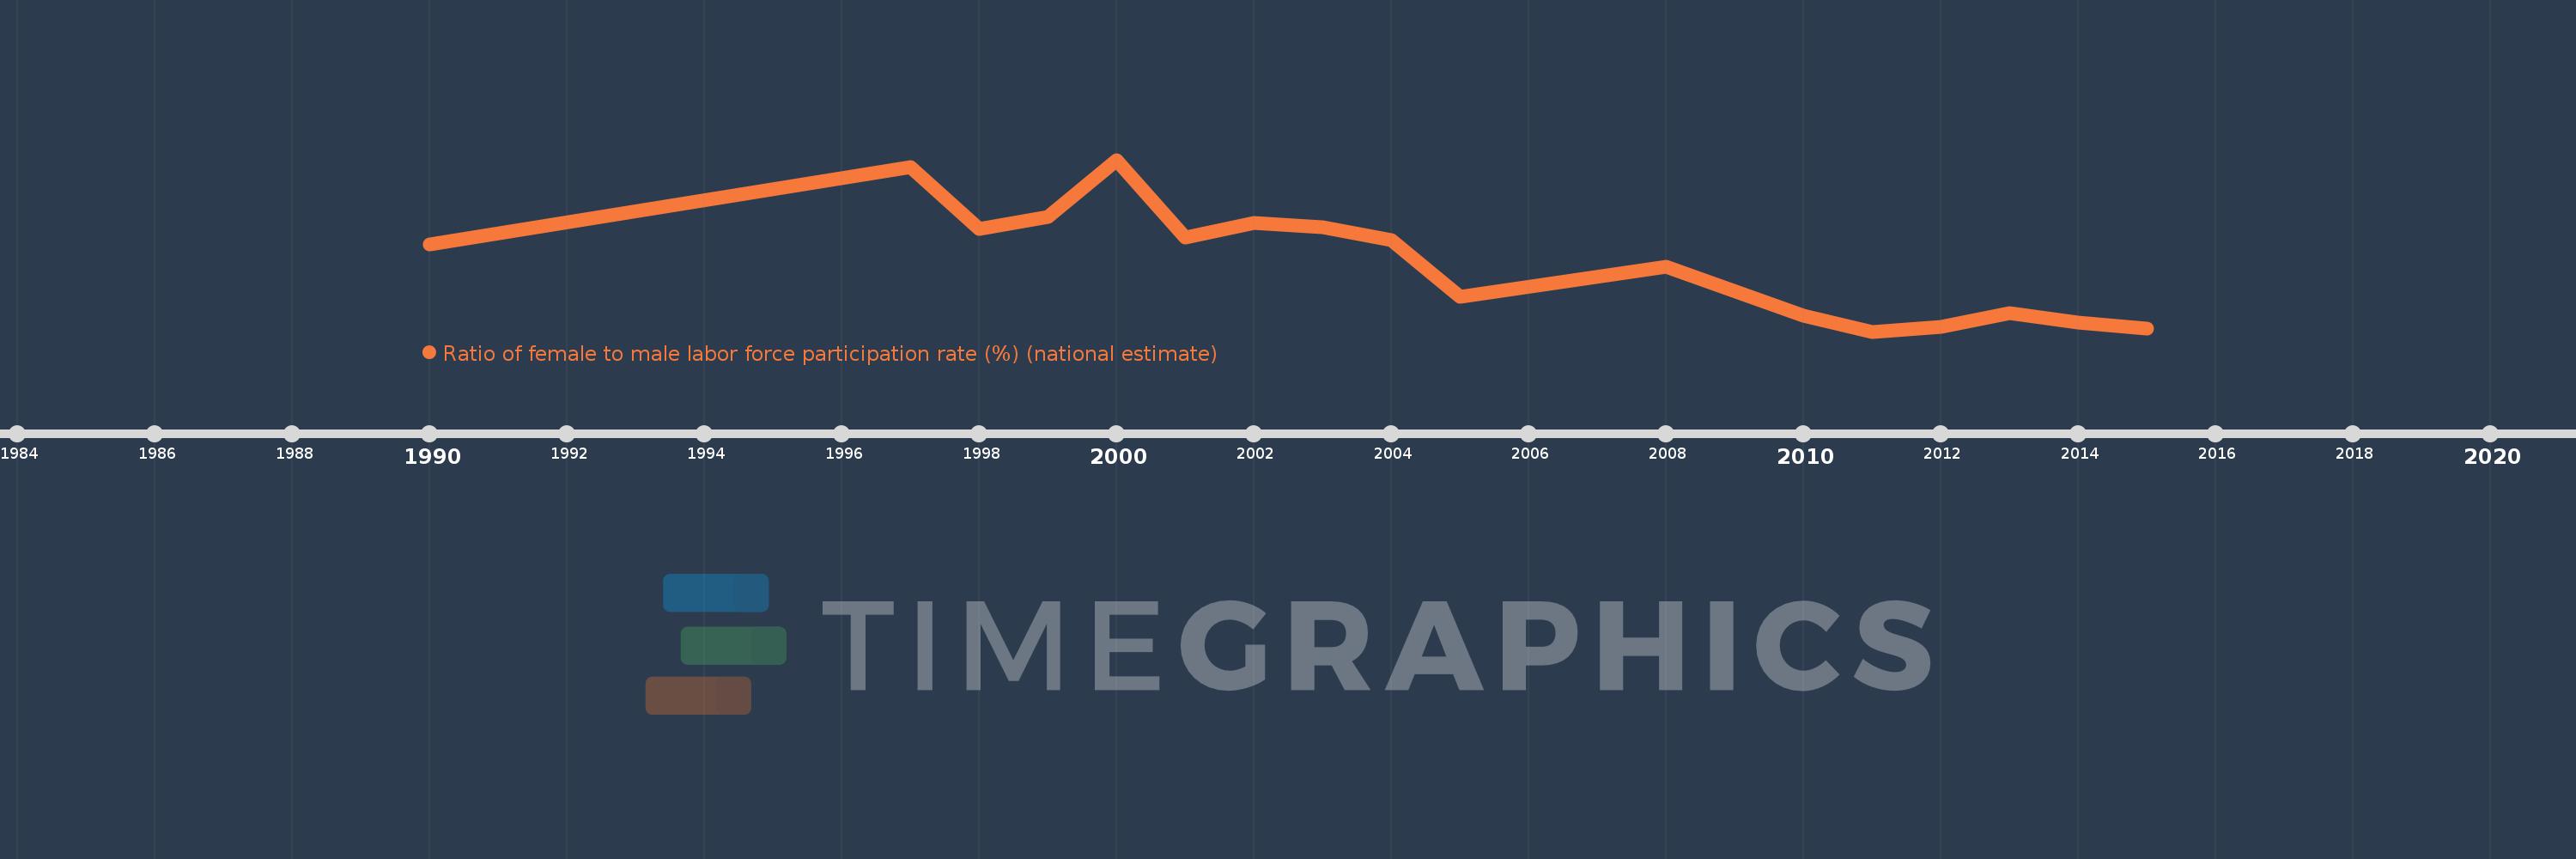
Nesta escala de tempo está apresentado um gráfico de 1990 ano até 2015 ano Vietnam. Dados de 1989 ano ausente. O número de observações reais por data: 17.
Fonte (nome):
Indicadores de desenvolvimento mundial
Fonte (organização):
International Labour Organization, Key Indicators of the Labour Market database.
Categorias:
Social Protection & Labor
Foi atualizado:
23 abr 2017 ano
Indicadores de alterações dos valores ao longo dos anos
Em média:
90.053
Mínimo:
89.024
1 jan 2011 ano
Máximo:
91.547
1 jan 2000 ano
Na data de observação
Valor
Mudança absoluta
A alteração em relação ao valor anterior
1 jan 1990 ano
90.307
+90.307
0.0%
1 jan 1997 ano
91.436
+1.129
1.25%
1 jan 1998 ano
90.537
-0.899
-0.98%
1 jan 1999 ano
90.71
+0.173
0.19%
1 jan 2000 ano
91.547
+0.838
0.92%
1 jan 2001 ano
90.407
-1.14
-1.25%
1 jan 2002 ano
90.625
+0.218
0.24%
1 jan 2003 ano
90.551
-0.074
-0.08%
1 jan 2004 ano
90.369
-0.182
-0.2%
1 jan 2005 ano
89.536
-0.833
-0.92%
1 jan 2008 ano
89.975
+0.438
0.49%
1 jan 2010 ano
89.259
-0.715
-0.8%
1 jan 2011 ano
89.024
-0.235
-0.26%
1 jan 2012 ano
89.093
+0.069
0.08%
1 jan 2013 ano
89.299
+0.206
0.23%
1 jan 2014 ano
89.16
-0.139
-0.16%
1 jan 2015 ano
89.064
-0.095
-0.11%
Classificação de países por estatísticas atuais por anos

Comentários:

Enviar
PremiumAbout & FeedbackAcordoPrivacidade
logo
© 2022 Selected Technologies LLC – Morgan Hill, California