33
/pt/
AIzaSyB4mHJ5NPEv-XzF7P6NDYXjlkCWaeKw5bc
November 1, 2025
281816
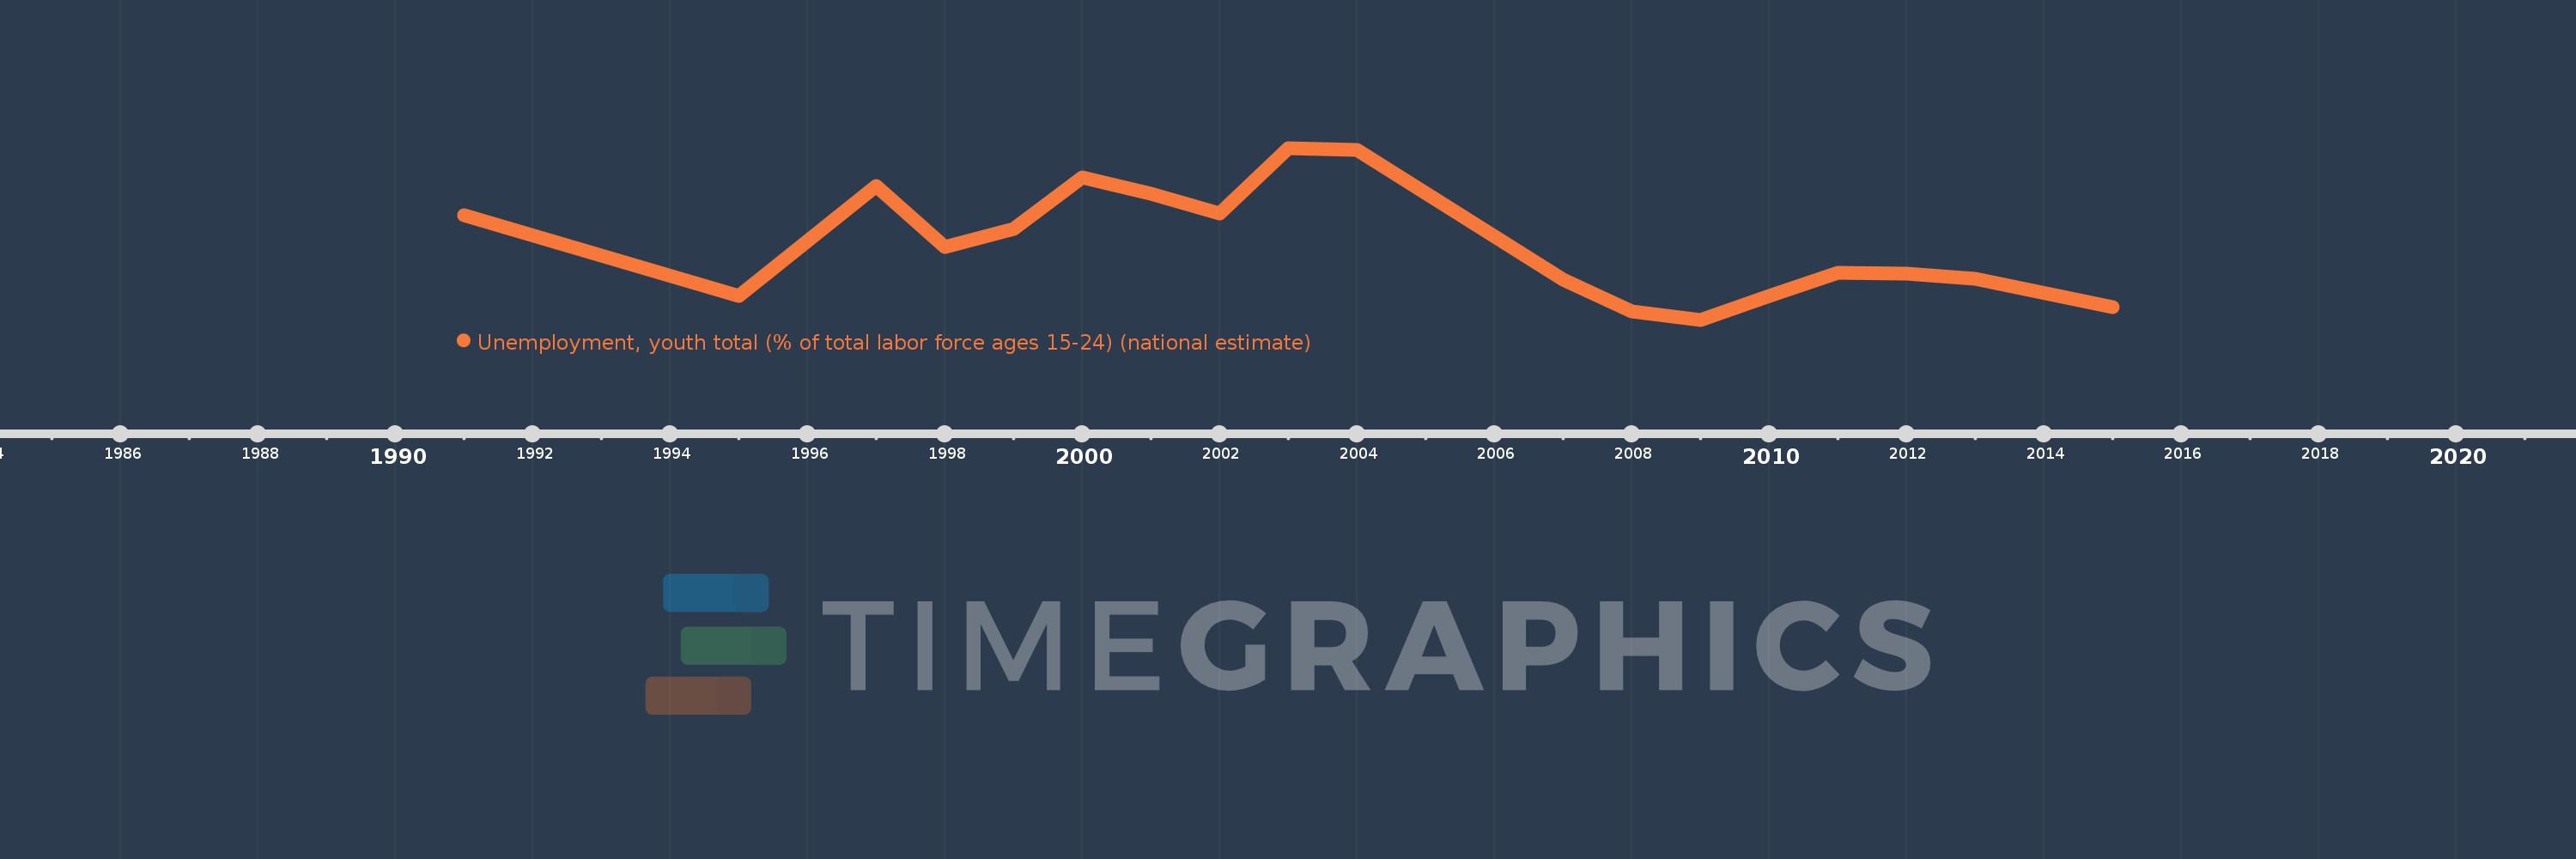
Venezuela, RB
VEN
true
2
1
Unemployment, youth total (% of total labor force ages 15-24) (national estimate)
2015,2013,2012,2011,2010,2009,2008,2007,2004,2003,2002,2001,2000,1999,1998,1997,1995,1991