33
/pt/
AIzaSyAYiBZKx7MnpbEhh9jyipgxe19OcubqV5w
August 1, 2025
279020
Uzbekistan
UZB
true
2
1
Natural gas rents (% of GDP)
2016,2015,2014,2013,2012,2011,2010,2009,2008,2007,2006,2005,2004,2003,2002,2001,2000,1999,1998,1997,1996,1995,1994,1993,1992,1991
Download
Biblioteca de estatísticas globais →Uzbekistan →

Natural gas rents (% of GDP)

Estas estatísticas em outros países:

AfghanistanAlbaniaAlgeriaAngolaArab WorldArgentinaArmeniaAustraliaAustriaAzerbaijanBahrainBangladeshBarbadosBelarusBelgiumBelizeBeninBoliviaBosnia and HerzegovinaBotswanaBrazilBrunei DarussalamBulgariaCambodiaCameroonCanadaCaribbean small statesCentral Europe and the BalticsChadChileChinaColombiaCongo, Dem. Rep.Congo, Rep.Costa RicaCote d'IvoireCroatiaCubaCyprusCzech RepublicDenmarkDominican RepublicEarly-demographic dividendEast Asia & PacificEast Asia & Pacific (excluding high income)East Asia & Pacific (IDA & IBRD countries)EcuadorEgypt, Arab Rep.El SalvadorEquatorial GuineaEritreaEstoniaEthiopiaEuro areaEurope & Central AsiaEurope & Central Asia (excluding high income)Europe & Central Asia (IDA & IBRD countries)European UnionFinlandFragile and conflict affected situationsFranceGabonGeorgiaGermanyGhanaGreeceGuatemalaHaitiHeavily indebted poor countries (HIPC)High incomeHondurasHungaryIBRD onlyIcelandIDA & IBRD totalIDA blendIDA onlyIDA totalIndiaIndonesiaIran, Islamic Rep.IraqIrelandIsraelItalyJamaicaJapanJordanKazakhstanKenyaKorea, Rep.KosovoKuwaitKyrgyz RepublicLate-demographic dividendLatin America & Caribbean Latin America & Caribbean (excluding high income)Latin America & the Caribbean (IDA & IBRD countries)LatviaLeast developed countries: UN classificationLebanonLibyaLithuaniaLow & middle incomeLow incomeLower middle incomeLuxembourgMacedonia, FYRMalaysiaMaltaMauritiusMexicoMiddle East & North AfricaMiddle East & North Africa (excluding high income)Middle East & North Africa (IDA & IBRD countries)Middle incomeMoldovaMongoliaMontenegroMoroccoMozambiqueMyanmarNamibiaNepalNetherlandsNew ZealandNicaraguaNigerNigeriaNorth AmericaNorwayOECD membersOmanOther small statesPakistanPanamaPapua New GuineaParaguayPeruPhilippinesPolandPortugalPost-demographic dividendPre-demographic dividendQatarRomaniaRussian FederationSaudi ArabiaSenegalSerbiaSingaporeSlovak RepublicSloveniaSmall statesSouth AfricaSouth AsiaSouth Asia (IDA & IBRD)South SudanSpainSri LankaSub-Saharan Africa Sub-Saharan Africa (excluding high income)Sub-Saharan Africa (IDA & IBRD countries)SudanSwedenSwitzerlandSyrian Arab RepublicTajikistanTanzaniaThailandTimor-LesteTogoTrinidad and TobagoTunisiaTurkeyTurkmenistanUkraineUnited Arab EmiratesUnited KingdomUnited StatesUpper middle incomeUruguayUzbekistanVenezuela, RBVietnamWest Bank and GazaWorldYemen, Rep.ZambiaZimbabwe

Linha do tempo:

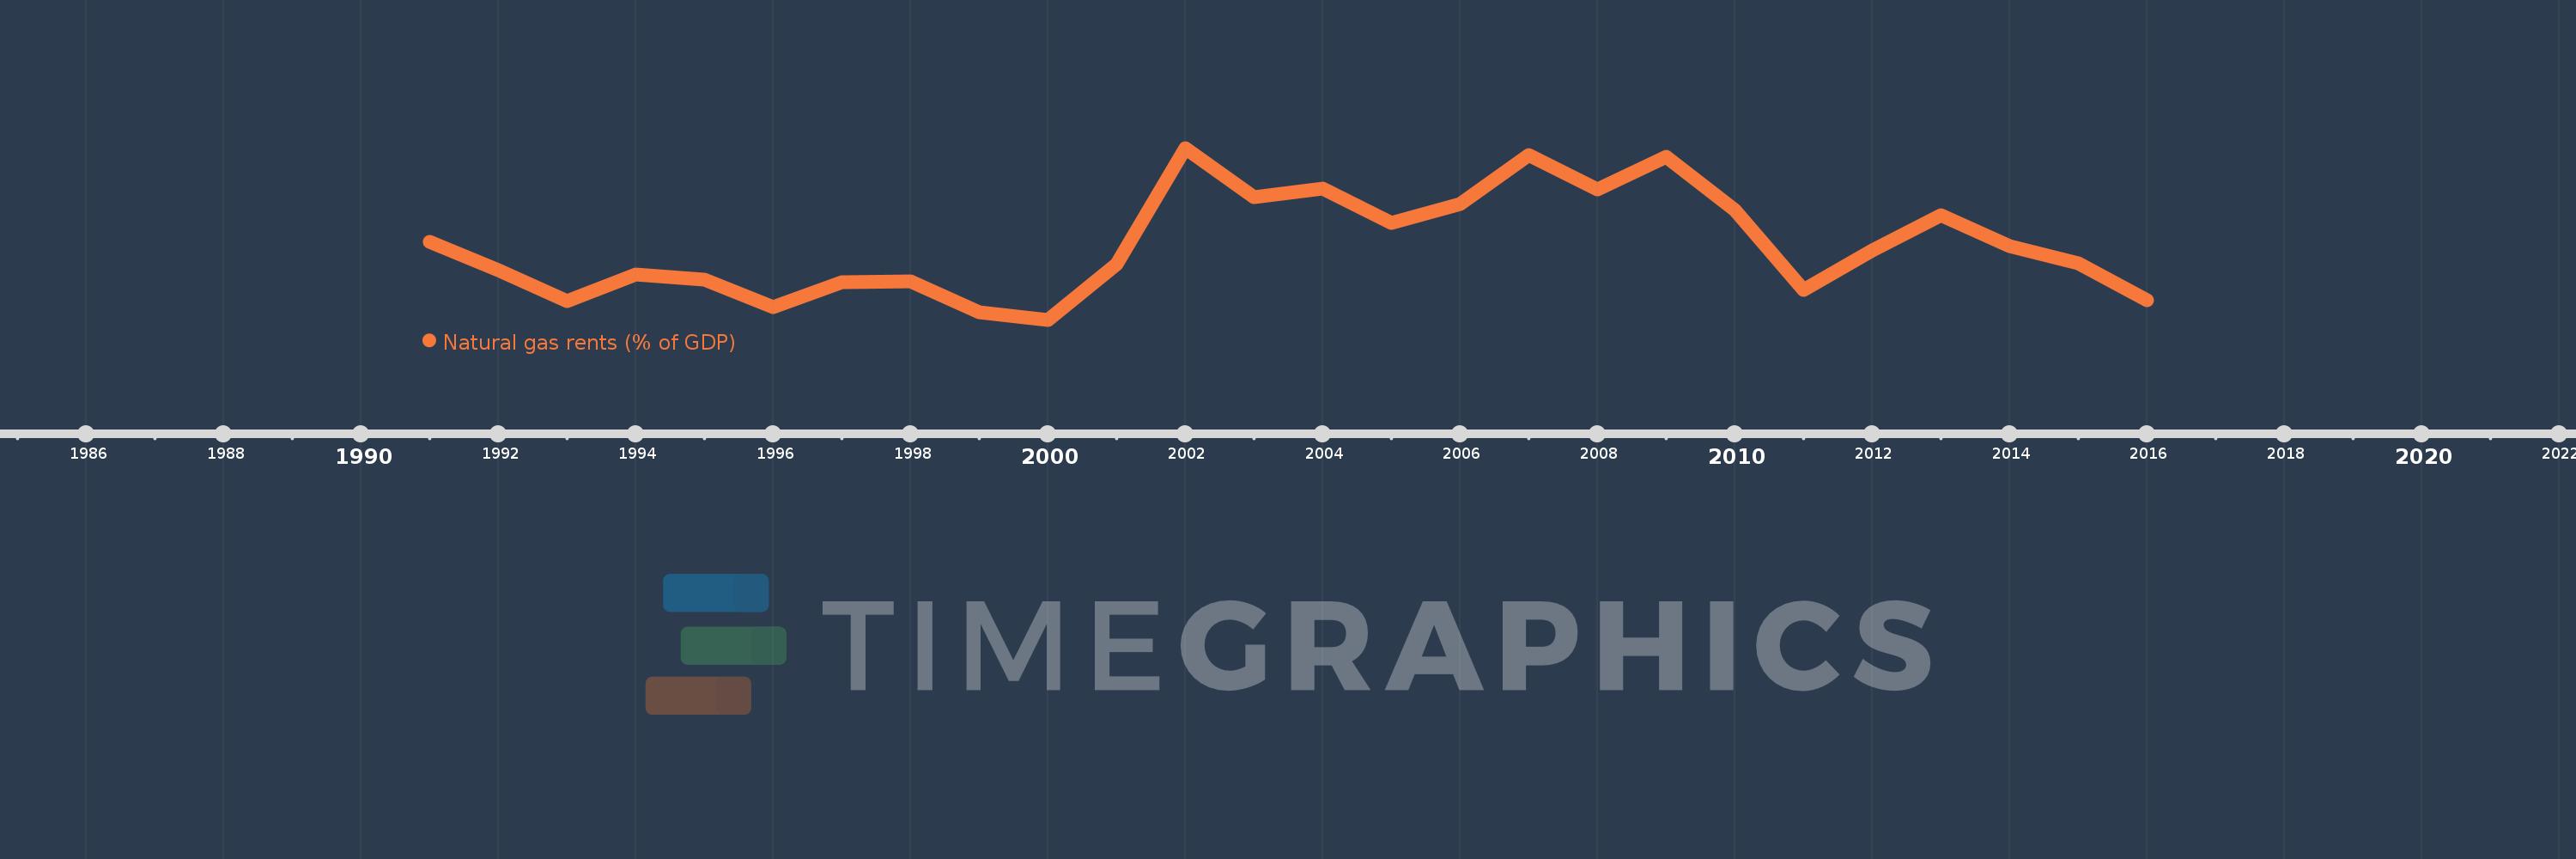
Nesta escala de tempo está apresentado um gráfico de 1991 ano até 2016 ano Uzbekistan. Dados de 1990 ano ausente. O número de observações reais por data: 26.

Fonte (nome):

Indicadores de desenvolvimento mundial

Fonte (organização):

Estimates based on sources and methods described in "The Changing Wealth of Nations: Measuring Sustainable Development in the New Millennium" (World Bank, 2011).

Categorias:

Energy & Mining, Environment

Foi atualizado:

23 abr 2017 ano

Indicadores de alterações dos valores ao longo dos anos

Em média:
9.89
Mínimo:
2.684
1 jan 2000 ano
Máximo:
19.265
1 jan 2002 ano
Na data de observação
Valor
Mudança absoluta
A alteração em relação ao valor anterior
1 jan 1991 ano
10.216
+10.216
0.0%
1 jan 1992 ano
7.469
-2.748
-26.89%
1 jan 1993 ano
4.475
-2.993
-40.08%
1 jan 1994 ano
7.066
+2.59
57.88%
1 jan 1995 ano
6.591
-0.474
-6.71%
1 jan 1996 ano
3.903
-2.688
-40.78%
1 jan 1997 ano
6.324
+2.42
62.01%
1 jan 1998 ano
6.371
+0.047
0.75%
1 jan 1999 ano
3.39
-2.981
-46.8%
1 jan 2000 ano
2.684
-0.706
-20.82%
1 jan 2001 ano
8.015
+5.331
198.6%
1 jan 2002 ano
19.265
+11.25
140.37%
1 jan 2003 ano
14.521
-4.744
-24.63%
1 jan 2004 ano
15.325
+0.805
5.54%
1 jan 2005 ano
12.058
-3.267
-21.32%
1 jan 2006 ano
13.872
+1.814
15.04%
1 jan 2007 ano
18.54
+4.668
33.65%
1 jan 2008 ano
15.236
-3.304
-17.82%
1 jan 2009 ano
18.401
+3.165
20.78%
1 jan 2010 ano
13.244
-5.157
-28.03%
1 jan 2011 ano
5.549
-7.695
-58.1%
1 jan 2012 ano
9.367
+3.819
68.82%
1 jan 2013 ano
12.75
+3.383
36.11%
1 jan 2014 ano
9.787
-2.963
-23.24%
1 jan 2015 ano
8.148
-1.639
-16.75%
1 jan 2016 ano
4.576
-3.572
-43.84%

Classificação de países por estatísticas atuais por anos