33
/pt/
AIzaSyB4mHJ5NPEv-XzF7P6NDYXjlkCWaeKw5bc
November 1, 2025
265816
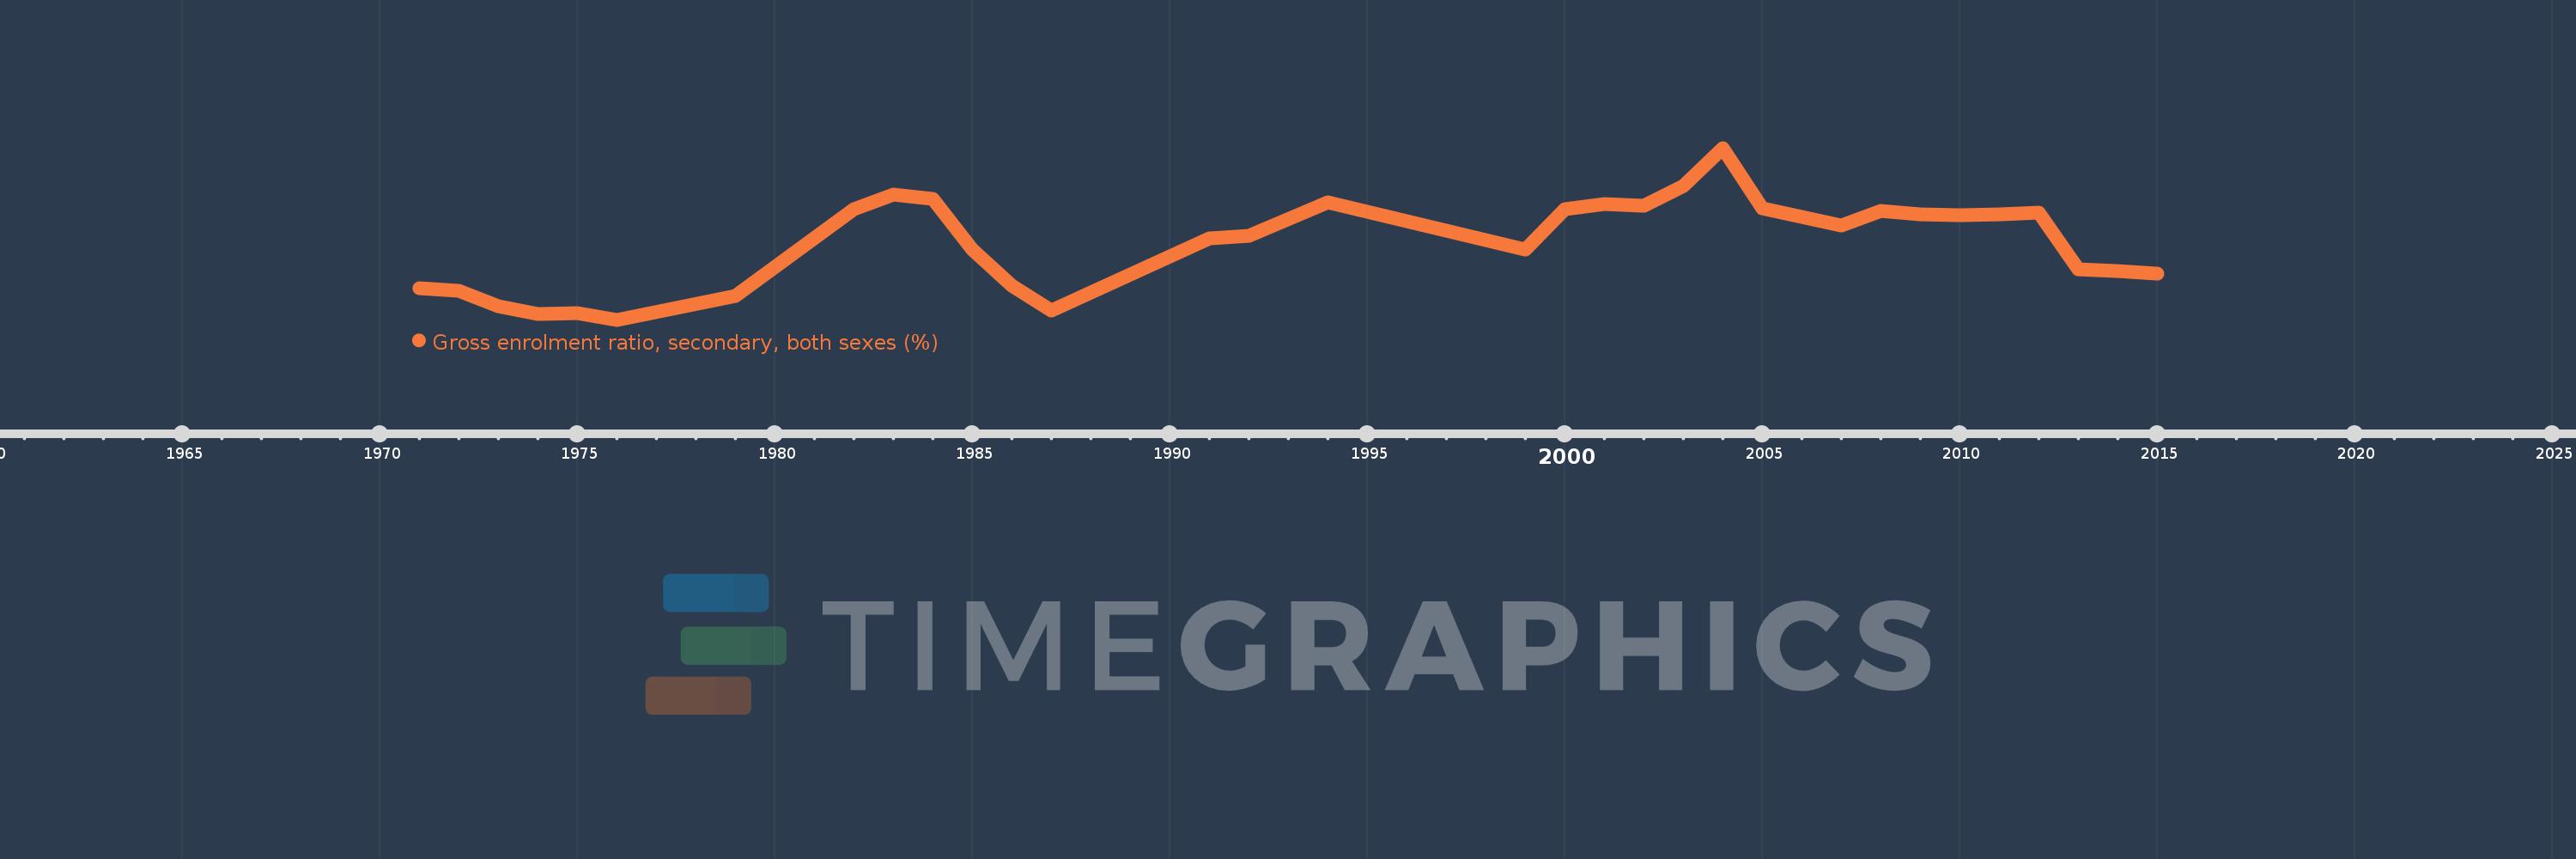
Tonga
TON
true
2
1
Gross enrolment ratio, secondary, both sexes (%)
2015,2014,2013,2012,2011,2010,2009,2008,2007,2005,2004,2003,2002,2001,2000,1999,1994,1992,1991,1987,1986,1985,1984,1983,1982,1979,1976,1975,1974,1973,1972,1971