33
/pt/
AIzaSyB4mHJ5NPEv-XzF7P6NDYXjlkCWaeKw5bc
November 1, 2025
265387
Togo
TGO
true
2
1
Trained teachers in preprimary education, male (% of male teachers)
2014,2013,2012,2011,2004,2003,2002,2001
Create a timeline
Public Timelines
For education
For educational institutions
For teachers
For students
Cabinet
For educational institutions
For teachers
For students
Open cabinet
FAQ
Receber premium
Close
Create a timeline
Public timelines
FAQ
About & Feedback
Acordo
Privacidade
FAQ
Support 24/7
Cabinet
Get premium
Donate
Download
Biblioteca de estatísticas globais
→
Togo
→
Trained teachers in preprimary education, male (% of male teachers)
Estas estatísticas em outros países:
Andorra
Angola
Arab World
Armenia
Aruba
Azerbaijan
Bahamas, The
Bahrain
Barbados
Belarus
Belize
Benin
Bhutan
Bolivia
Botswana
Brunei Darussalam
Burkina Faso
Burundi
Cambodia
Cameroon
Caribbean small states
Cayman Islands
Chad
Colombia
Congo, Dem. Rep.
Congo, Rep.
Costa Rica
Cote d'Ivoire
Croatia
Cuba
Djibouti
Dominican Republic
Ecuador
Egypt, Arab Rep.
El Salvador
Eritrea
Ethiopia
Fragile and conflict affected situations
Gambia, The
Ghana
Grenada
Guinea
Guinea-Bissau
Guyana
Heavily indebted poor countries (HIPC)
Honduras
IDA blend
IDA only
IDA total
Kazakhstan
Kenya
Kuwait
Kyrgyz Republic
Lao PDR
Least developed countries: UN classification
Lebanon
Liberia
Low income
Macao SAR, China
Madagascar
Malaysia
Maldives
Mali
Marshall Islands
Mauritania
Mauritius
Middle East & North Africa
Middle East & North Africa (excluding high income)
Middle East & North Africa (IDA & IBRD countries)
Mongolia
Morocco
Myanmar
Namibia
Nauru
Nepal
Nicaragua
Niger
Oman
Other small states
Pacific island small states
Panama
Paraguay
Pre-demographic dividend
Qatar
Rwanda
Samoa
Sao Tome and Principe
Senegal
Serbia
Seychelles
Sierra Leone
Small states
Solomon Islands
South Africa
South Sudan
St. Vincent and the Grenadines
Sub-Saharan Africa
Sub-Saharan Africa (excluding high income)
Sub-Saharan Africa (IDA & IBRD countries)
Suriname
Swaziland
Syrian Arab Republic
Tanzania
Togo
United Arab Emirates
Uzbekistan
Vietnam
West Bank and Gaza
Zimbabwe
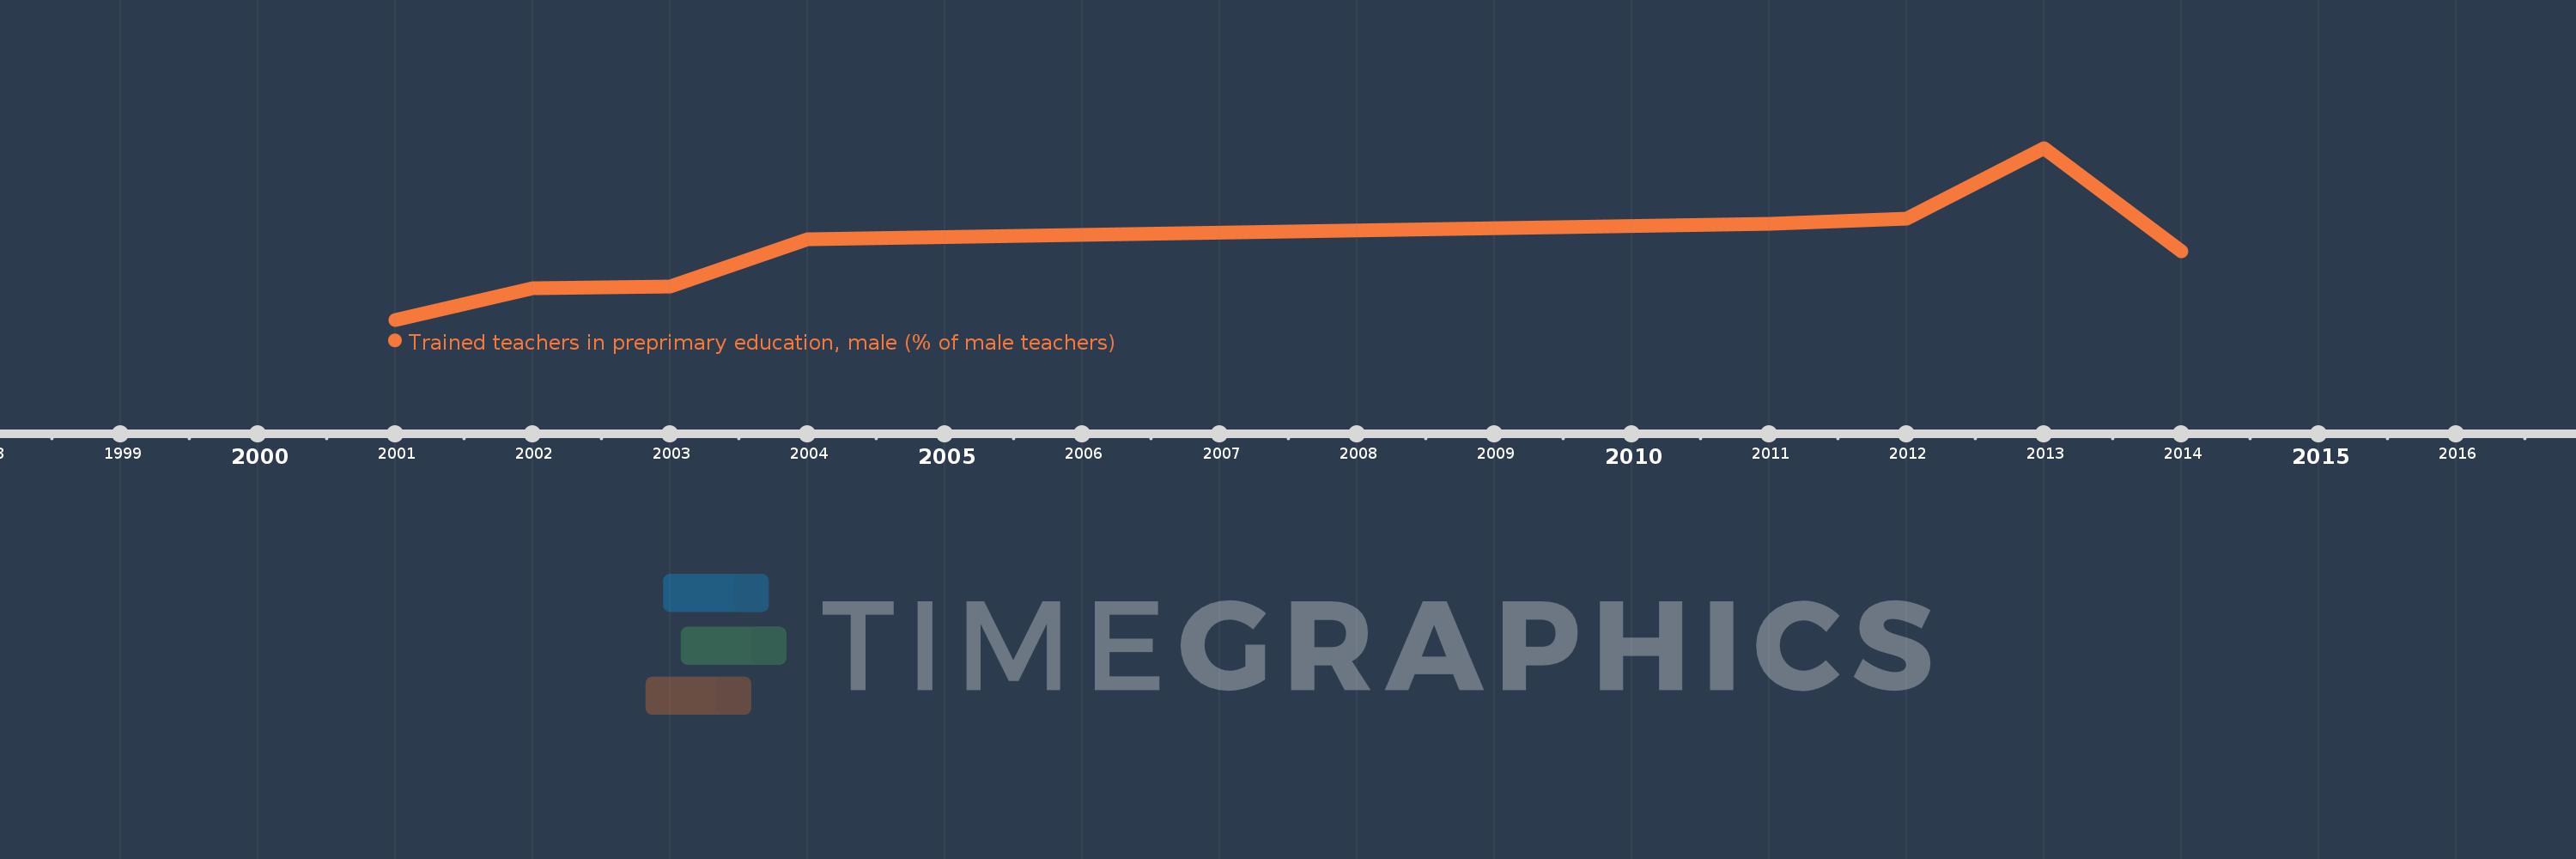
Linha do tempo:
Nesta escala de tempo está apresentado um gráfico de
2001
ano até
2014
ano Togo. Dados de
2000
ano ausente. O número de observações reais por data:
8
.
Fonte (nome):
Indicadores de desenvolvimento mundial
Fonte (organização):
United Nations Educational, Scientific, and Cultural Organization (UNESCO) Institute for Statistics.
Categorias:
Education
Foi atualizado:
23 abr 2017 ano
Indicadores de alterações dos valores ao longo dos anos
Em média:
33.965
Mínimo:
13.333
1 jan 2001 ano
Máximo:
62.015
1 jan 2013 ano
Na data de observação
Valor
Mudança absoluta
A alteração em relação ao valor anterior
1 jan 2001 ano
13.333
+13.333
0.0%
1 jan 2002 ano
22.222
+8.889
66.67%
1 jan 2003 ano
22.727
+0.505
2.27%
1 jan 2004 ano
36.066
+13.338
58.69%
1 jan 2011 ano
40.517
+4.452
12.34%
1 jan 2012 ano
42.056
+1.539
3.8%
1 jan 2013 ano
62.015
+19.959
47.46%
1 jan 2014 ano
32.78
-29.235
-47.14%
Classificação de países por estatísticas atuais por anos
About & Feedback
Acordo
Privacidade
FAQ
Support 24/7
Cabinet
Get premium
Donate
The service accepts bank transfer (ACH, Wire) or cards (Visa, MasterCard, etc). Processed by Stripe.
Secured with SSL