33
/pt/
AIzaSyB4mHJ5NPEv-XzF7P6NDYXjlkCWaeKw5bc
November 1, 2025
265348
Togo
TGO
true
2
1
Technicians in R&D (per million people)
2015,2013,2012,2011,2008,2007,2006,2005,2004
Create a timeline
Public Timelines
For education
For educational institutions
For teachers
For students
Cabinet
For educational institutions
For teachers
For students
Open cabinet
FAQ
Receber premium
Close
Create a timeline
Public timelines
FAQ
About & Feedback
Acordo
Privacidade
FAQ
Support 24/7
Cabinet
Get premium
Donate
Download
Biblioteca de estatísticas globais
→
Togo
→
Technicians in R&D (per million people)
Estas estatísticas em outros países:
Albania
Algeria
Angola
Argentina
Australia
Austria
Bahrain
Belgium
Bolivia
Bosnia and Herzegovina
Botswana
Brazil
Bulgaria
Burkina Faso
Cabo Verde
Cambodia
Canada
Central Europe and the Baltics
Chile
Congo, Rep.
Croatia
Cyprus
Czech Republic
Denmark
Ecuador
Egypt, Arab Rep.
Estonia
Ethiopia
Euro area
Europe & Central Asia
Europe & Central Asia (excluding high income)
Europe & Central Asia (IDA & IBRD countries)
European Union
Faroe Islands
France
Gambia, The
Georgia
Germany
Ghana
Greece
Greenland
Guatemala
Hong Kong SAR, China
Hungary
Iceland
India
Iran, Islamic Rep.
Iraq
Ireland
Israel
Italy
Japan
Jordan
Kazakhstan
Kenya
Korea, Rep.
Kuwait
Latin America & Caribbean
Latin America & Caribbean (excluding high income)
Latin America & the Caribbean (IDA & IBRD countries)
Latvia
Lesotho
Lithuania
Luxembourg
Macao SAR, China
Macedonia, FYR
Madagascar
Malawi
Malaysia
Mali
Malta
Mauritius
Mexico
Moldova
Montenegro
Morocco
Mozambique
Myanmar
Nepal
Netherlands
New Zealand
Niger
Nigeria
Oman
Pakistan
Panama
Paraguay
Philippines
Poland
Portugal
Puerto Rico
Qatar
Romania
Russian Federation
Rwanda
Senegal
Serbia
Seychelles
Singapore
Slovak Republic
Slovenia
South Africa
South Asia
South Asia (IDA & IBRD)
Spain
Sri Lanka
Sweden
Switzerland
Tanzania
Thailand
Togo
Tunisia
Turkey
Uganda
Ukraine
United Kingdom
Uzbekistan
West Bank and Gaza
Zambia
Zimbabwe
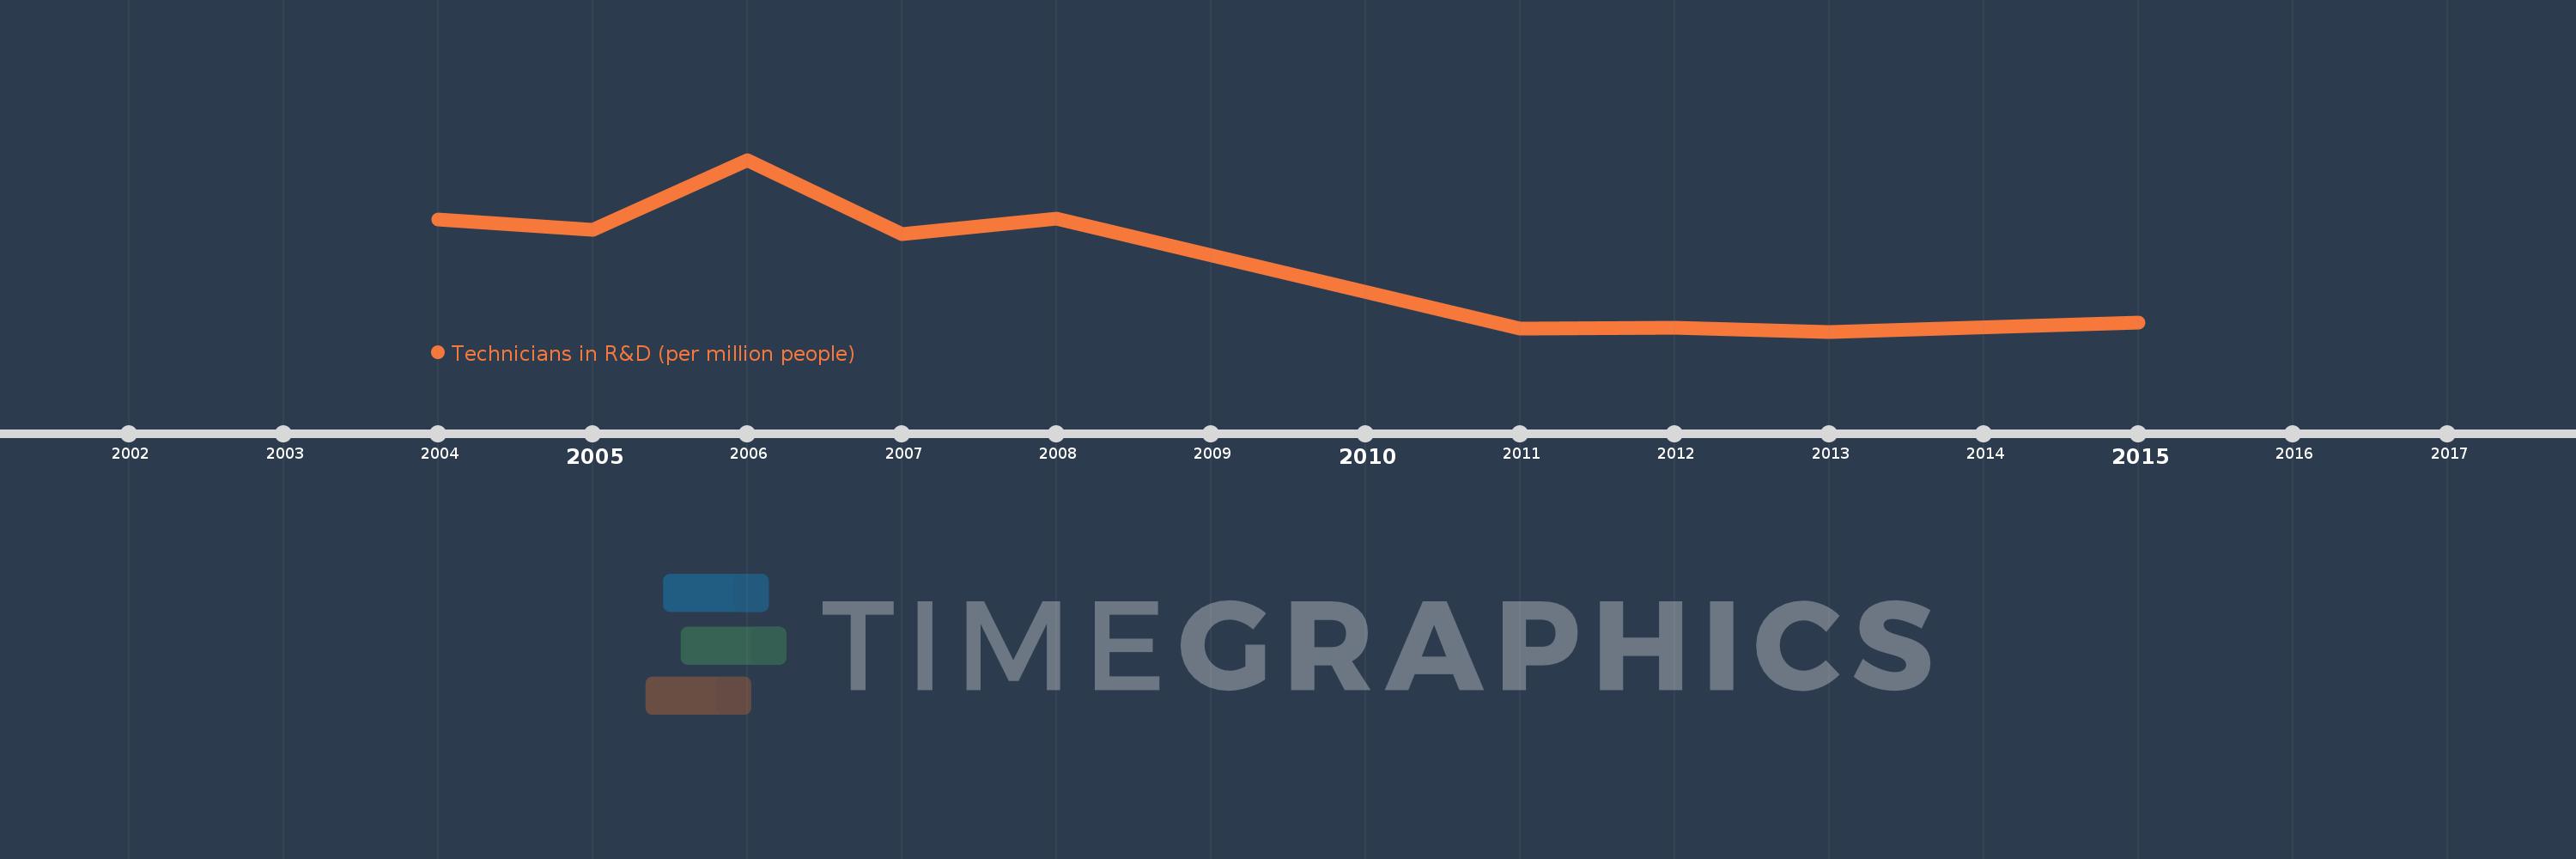
Linha do tempo:
Nesta escala de tempo está apresentado um gráfico de
2004
ano até
2015
ano Togo. Dados de
2003
ano ausente. O número de observações reais por data:
9
.
Fonte (nome):
Indicadores de desenvolvimento mundial
Fonte (organização):
United Nations Educational, Scientific, and Cultural Organization (UNESCO) Institute for Statistics.
Categorias:
Science & Technology
Foi atualizado:
23 abr 2017 ano
Indicadores de alterações dos valores ao longo dos anos
Em média:
13.938
Mínimo:
8.265
1 jan 2013 ano
Máximo:
22.588
1 jan 2006 ano
Na data de observação
Valor
Mudança absoluta
A alteração em relação ao valor anterior
1 jan 2004 ano
17.603
+17.603
0.0%
1 jan 2005 ano
16.763
-0.84
-4.77%
1 jan 2006 ano
22.588
+5.825
34.75%
1 jan 2007 ano
16.399
-6.189
-27.4%
1 jan 2008 ano
17.656
+1.257
7.67%
1 jan 2011 ano
8.512
-9.144
-51.79%
1 jan 2012 ano
8.62
+0.108
1.27%
1 jan 2013 ano
8.265
-0.355
-4.12%
1 jan 2015 ano
9.037
+0.772
9.35%
Classificação de países por estatísticas atuais por anos
About & Feedback
Acordo
Privacidade
FAQ
Support 24/7
Cabinet
Get premium
Donate
The service accepts bank transfer (ACH, Wire) or cards (Visa, MasterCard, etc). Processed by Stripe.
Secured with SSL