33
/pt/
AIzaSyB4mHJ5NPEv-XzF7P6NDYXjlkCWaeKw5bc
November 30, 2025
264225
Togo
TGO
true
2
1
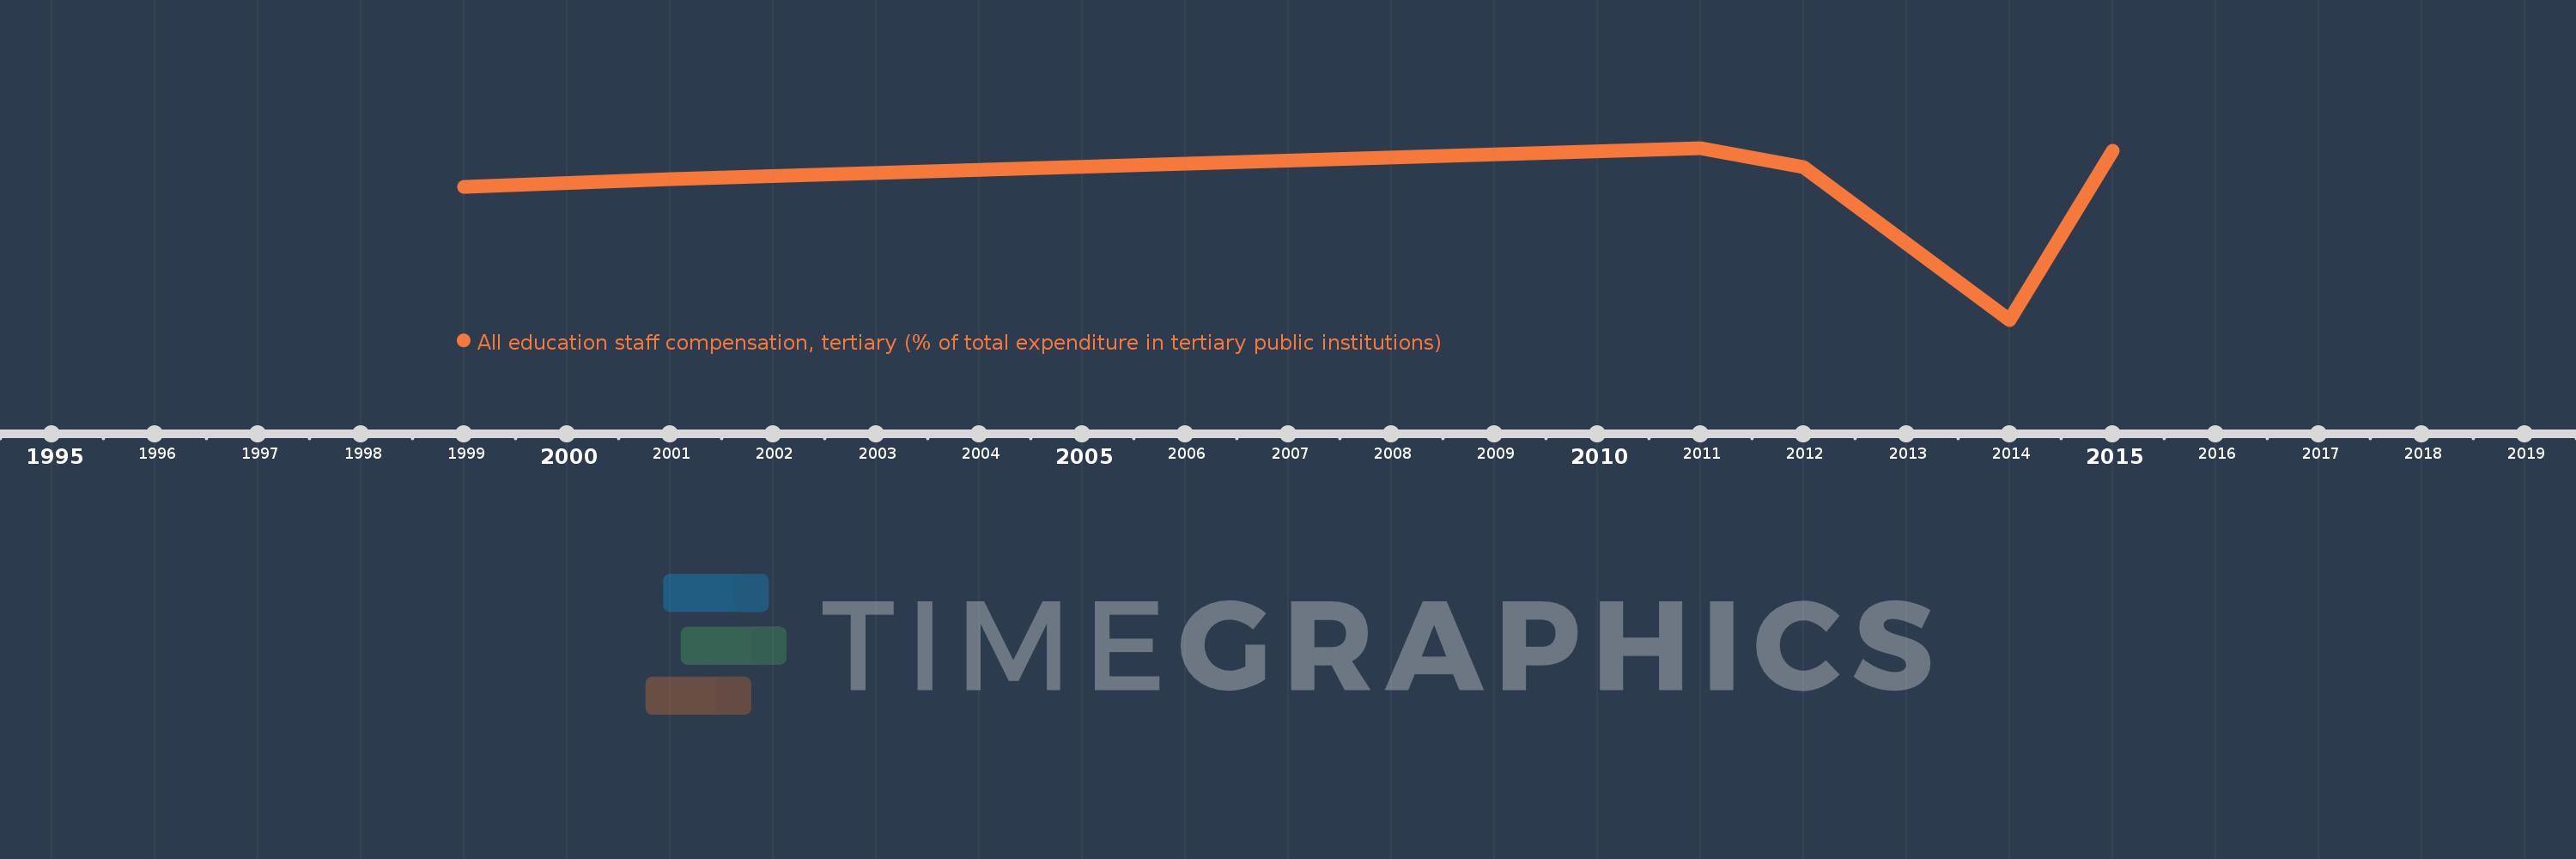
All education staff compensation, tertiary (% of total expenditure in tertiary public institutions)
2015,2014,2012,2011,2001,1999
Create a timeline
Public Timelines
For education
For educational institutions
For teachers
For students
Cabinet
For educational institutions
For teachers
For students
Open cabinet
FAQ
Close
Create a timeline
Public timelines
FAQ
About & Feedback
Acordo
Privacidade
FAQ
Support 24/7
Cabinet
Get premium
Donate
Download
Biblioteca de estatísticas globais
→
Togo
→
All education staff compensation, tertiary (% of total expenditure in tertiary public institutions)
Estas estatísticas em outros países:
Albania
Andorra
Antigua and Barbuda
Argentina
Armenia
Aruba
Australia
Austria
Azerbaijan
Bangladesh
Barbados
Belarus
Belgium
Belize
Benin
Bermuda
Bolivia
Brazil
British Virgin Islands
Bulgaria
Burkina Faso
Burundi
Cabo Verde
Cameroon
Canada
Caribbean small states
Central African Republic
Central Europe and the Baltics
Chile
China
Colombia
Comoros
Congo, Dem. Rep.
Congo, Rep.
Cote d'Ivoire
Croatia
Cuba
Curacao
Cyprus
Czech Republic
Denmark
Dominican Republic
Ecuador
El Salvador
Eritrea
Estonia
Ethiopia
Euro area
Europe & Central Asia
Europe & Central Asia (excluding high income)
Europe & Central Asia (IDA & IBRD countries)
European Union
Finland
France
Gambia, The
Germany
Ghana
Greece
Grenada
Guatemala
Guinea
Guinea-Bissau
Guyana
High income
Honduras
Hong Kong SAR, China
Hungary
Iceland
India
Indonesia
Ireland
Israel
Italy
Jamaica
Japan
Jordan
Kazakhstan
Korea, Rep.
Kuwait
Kyrgyz Republic
Latvia
Lebanon
Lithuania
Macao SAR, China
Macedonia, FYR
Madagascar
Malaysia
Mali
Malta
Mexico
Moldova
Mongolia
Morocco
Mozambique
Namibia
Netherlands
Niger
North America
Norway
OECD members
Oman
Panama
Paraguay
Peru
Philippines
Poland
Portugal
Post-demographic dividend
Puerto Rico
Romania
Russian Federation
Rwanda
Senegal
Serbia
Seychelles
Slovak Republic
Slovenia
South Africa
Spain
Sri Lanka
St. Kitts and Nevis
Sweden
Switzerland
Thailand
Timor-Leste
Togo
Tunisia
Turkey
Uganda
Ukraine
United States
Uruguay
Venezuela, RB
Vietnam
Zimbabwe
Linha do tempo:
Nesta escala de tempo está apresentado um gráfico de
1999
ano até
2015
ano Togo. Dados de
1998
ano ausente. O número de observações reais por data:
6
.
Fonte (nome):
Indicadores de desenvolvimento mundial
Fonte (organização):
United Nations Educational, Scientific, and Cultural Organization (UNESCO) Institute for Statistics.
Categorias:
Education
Foi atualizado:
23 abr 2017 ano
Indicadores de alterações dos valores ao longo dos anos
Em média:
45.04
Mínimo:
0.0
1 jan 2014 ano
Máximo:
60.533
1 jan 2011 ano
Na data de observação
Valor
Mudança absoluta
A alteração em relação ao valor anterior
1 jan 1999 ano
46.812
+46.812
0.0%
1 jan 2001 ano
49.405
+2.592
5.54%
1 jan 2011 ano
60.533
+11.128
22.52%
1 jan 2012 ano
53.889
-6.644
-10.98%
1 jan 2014 ano
0.0
-53.889
-100.0%
1 jan 2015 ano
59.601
+59.601
%
Classificação de países por estatísticas atuais por anos
About & Feedback
Acordo
Privacidade
FAQ
Support 24/7
Cabinet
Get premium
Donate
The service accepts bank transfer (ACH, Wire) or cards (Visa, MasterCard, etc). Processed by Stripe.
Secured with SSL