33
/pt/
AIzaSyAYiBZKx7MnpbEhh9jyipgxe19OcubqV5w
August 1, 2025
260201
Tajikistan
TJK
true
2
1
Public and publicly guaranteed debt service (% of GNI)
2016,2015,2014,2013,2012,2011,2010,2009,2008,2007,2006,2005,2004,2003,2002,2001,2000,1999,1998,1997,1995,1994
Download
Biblioteca de estatísticas globais →Tajikistan →

Public and publicly guaranteed debt service (% of GNI)

Estas estatísticas em outros países:

AfghanistanAlbaniaAlgeriaAngolaArab WorldArgentinaArmeniaAzerbaijanBangladeshBelarusBelizeBeninBhutanBoliviaBosnia and HerzegovinaBotswanaBrazilBulgariaBurkina FasoBurundiCabo VerdeCambodiaCameroonCentral African RepublicCentral Europe and the BalticsChadChinaColombiaComorosCongo, Dem. Rep.Congo, Rep.Costa RicaCote d'IvoireDjiboutiDominicaDominican RepublicEarly-demographic dividendEast Asia & Pacific (excluding high income)East Asia & Pacific (IDA & IBRD countries)EcuadorEgypt, Arab Rep.El SalvadorEritreaEthiopiaEurope & Central Asia (excluding high income)Europe & Central Asia (IDA & IBRD countries)FijiFragile and conflict affected situationsGabonGambia, TheGeorgiaGhanaGrenadaGuatemalaGuineaGuinea-BissauGuyanaHaitiHeavily indebted poor countries (HIPC)HondurasIBRD onlyIDA & IBRD totalIDA blendIDA onlyIDA totalIndiaIndonesiaIran, Islamic Rep.JamaicaJordanKazakhstanKenyaKosovoKyrgyz RepublicLao PDRLate-demographic dividendLatin America & Caribbean Latin America & Caribbean (excluding high income)Latin America & the Caribbean (IDA & IBRD countries)Least developed countries: UN classificationLebanonLesothoLiberiaLow & middle incomeLow incomeLower middle incomeMacedonia, FYRMadagascarMalawiMalaysiaMaldivesMaliMauritaniaMauritiusMexicoMiddle East & North Africa (excluding high income)Middle East & North Africa (IDA & IBRD countries)Middle incomeMoldovaMongoliaMontenegroMoroccoMozambiqueMyanmarNepalNicaraguaNigerNigeriaPacific island small statesPakistanPanamaPapua New GuineaParaguayPeruPhilippinesPre-demographic dividendRomaniaRussian FederationRwandaSamoaSao Tome and PrincipeSenegalSerbiaSierra LeoneSolomon IslandsSomaliaSouth AfricaSouth AsiaSouth Asia (IDA & IBRD)Sri LankaSt. Kitts and NevisSt. LuciaSt. Vincent and the GrenadinesSub-Saharan Africa Sub-Saharan Africa (excluding high income)Sub-Saharan Africa (IDA & IBRD countries)SudanSwazilandSyrian Arab RepublicTajikistanTanzaniaThailandTogoTongaTunisiaTurkeyTurkmenistanUgandaUkraineUpper middle incomeUzbekistanVanuatuVenezuela, RBVietnamYemen, Rep.ZambiaZimbabwe

Linha do tempo:

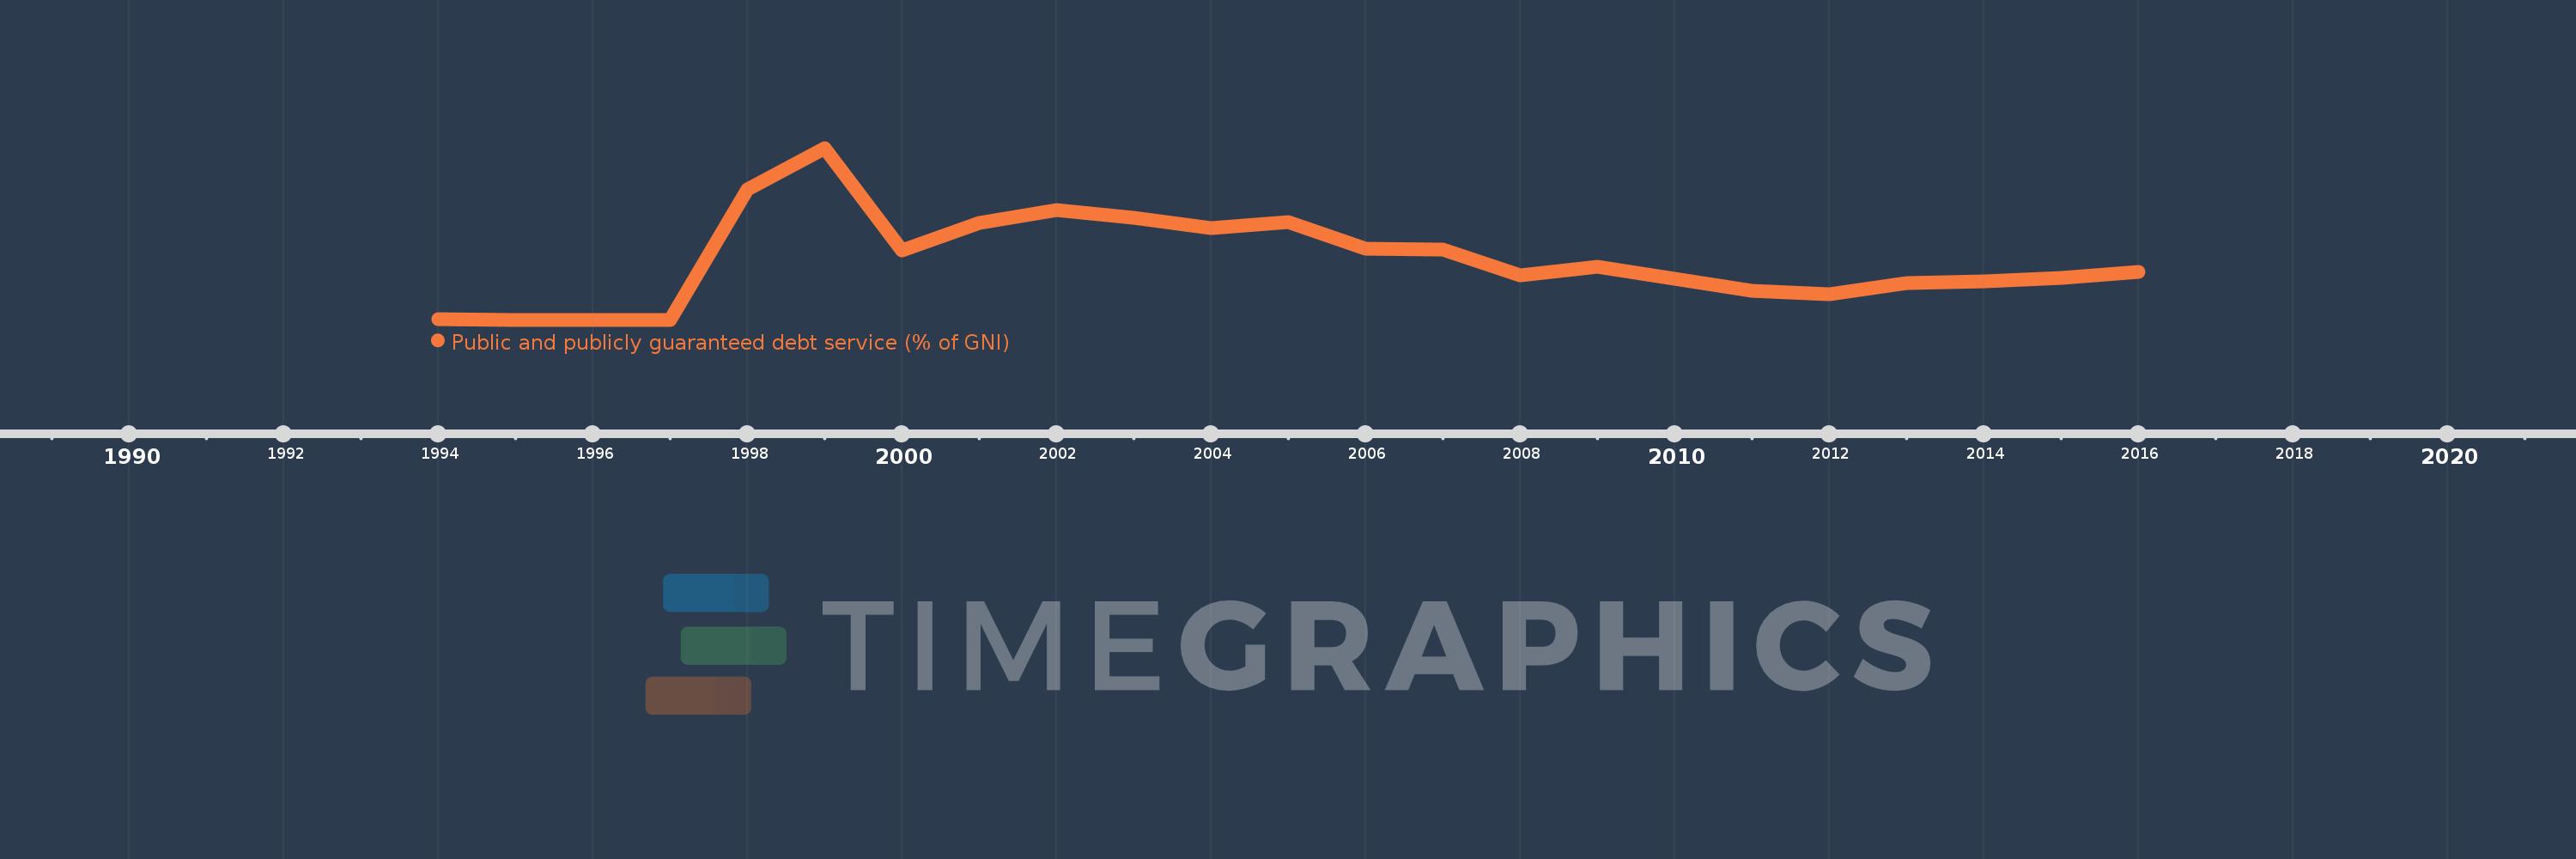
Nesta escala de tempo está apresentado um gráfico de 1994 ano até 2016 ano Tajikistan. Dados de 1993 ano ausente. O número de observações reais por data: 22.

Fonte (nome):

Indicadores de desenvolvimento mundial

Fonte (organização):

World Bank, International Debt Statistics.

Categorias:

External Debt

Foi atualizado:

23 abr 2017 ano

Indicadores de alterações dos valores ao longo dos anos

Em média:
1.79
Mínimo:
0.029
1 jan 1997 ano
Máximo:
4.893
1 jan 1999 ano
Na data de observação
Valor
Mudança absoluta
A alteração em relação ao valor anterior
1 jan 1994 ano
0.052
+0.052
0.0%
1 jan 1995 ano
0.031
-0.021
-40.95%
1 jan 1997 ano
0.029
-0.002
-6.47%
1 jan 1998 ano
3.726
+3.697
12.91 mil%
1 jan 1999 ano
4.893
+1.167
31.33%
1 jan 2000 ano
1.994
-2.898
-59.24%
1 jan 2001 ano
2.77
+0.776
38.9%
1 jan 2002 ano
3.138
+0.368
13.28%
1 jan 2003 ano
2.918
-0.22
-7.02%
1 jan 2004 ano
2.616
-0.302
-10.35%
1 jan 2005 ano
2.793
+0.177
6.76%
1 jan 2006 ano
2.05
-0.742
-26.59%
1 jan 2007 ano
2.015
-0.035
-1.71%
1 jan 2008 ano
1.275
-0.74
-36.72%
1 jan 2009 ano
1.522
+0.247
19.35%
1 jan 2010 ano
1.192
-0.33
-21.69%
1 jan 2011 ano
0.858
-0.334
-28.03%
1 jan 2012 ano
0.744
-0.114
-13.26%
1 jan 2013 ano
1.065
+0.321
43.11%
1 jan 2014 ano
1.106
+0.041
3.83%
1 jan 2015 ano
1.204
+0.098
8.88%
1 jan 2016 ano
1.392
+0.188
15.63%

Classificação de países por estatísticas atuais por anos