33
/pt/
AIzaSyB4mHJ5NPEv-XzF7P6NDYXjlkCWaeKw5bc
November 1, 2025
253840
Suriname
SUR
true
2
1
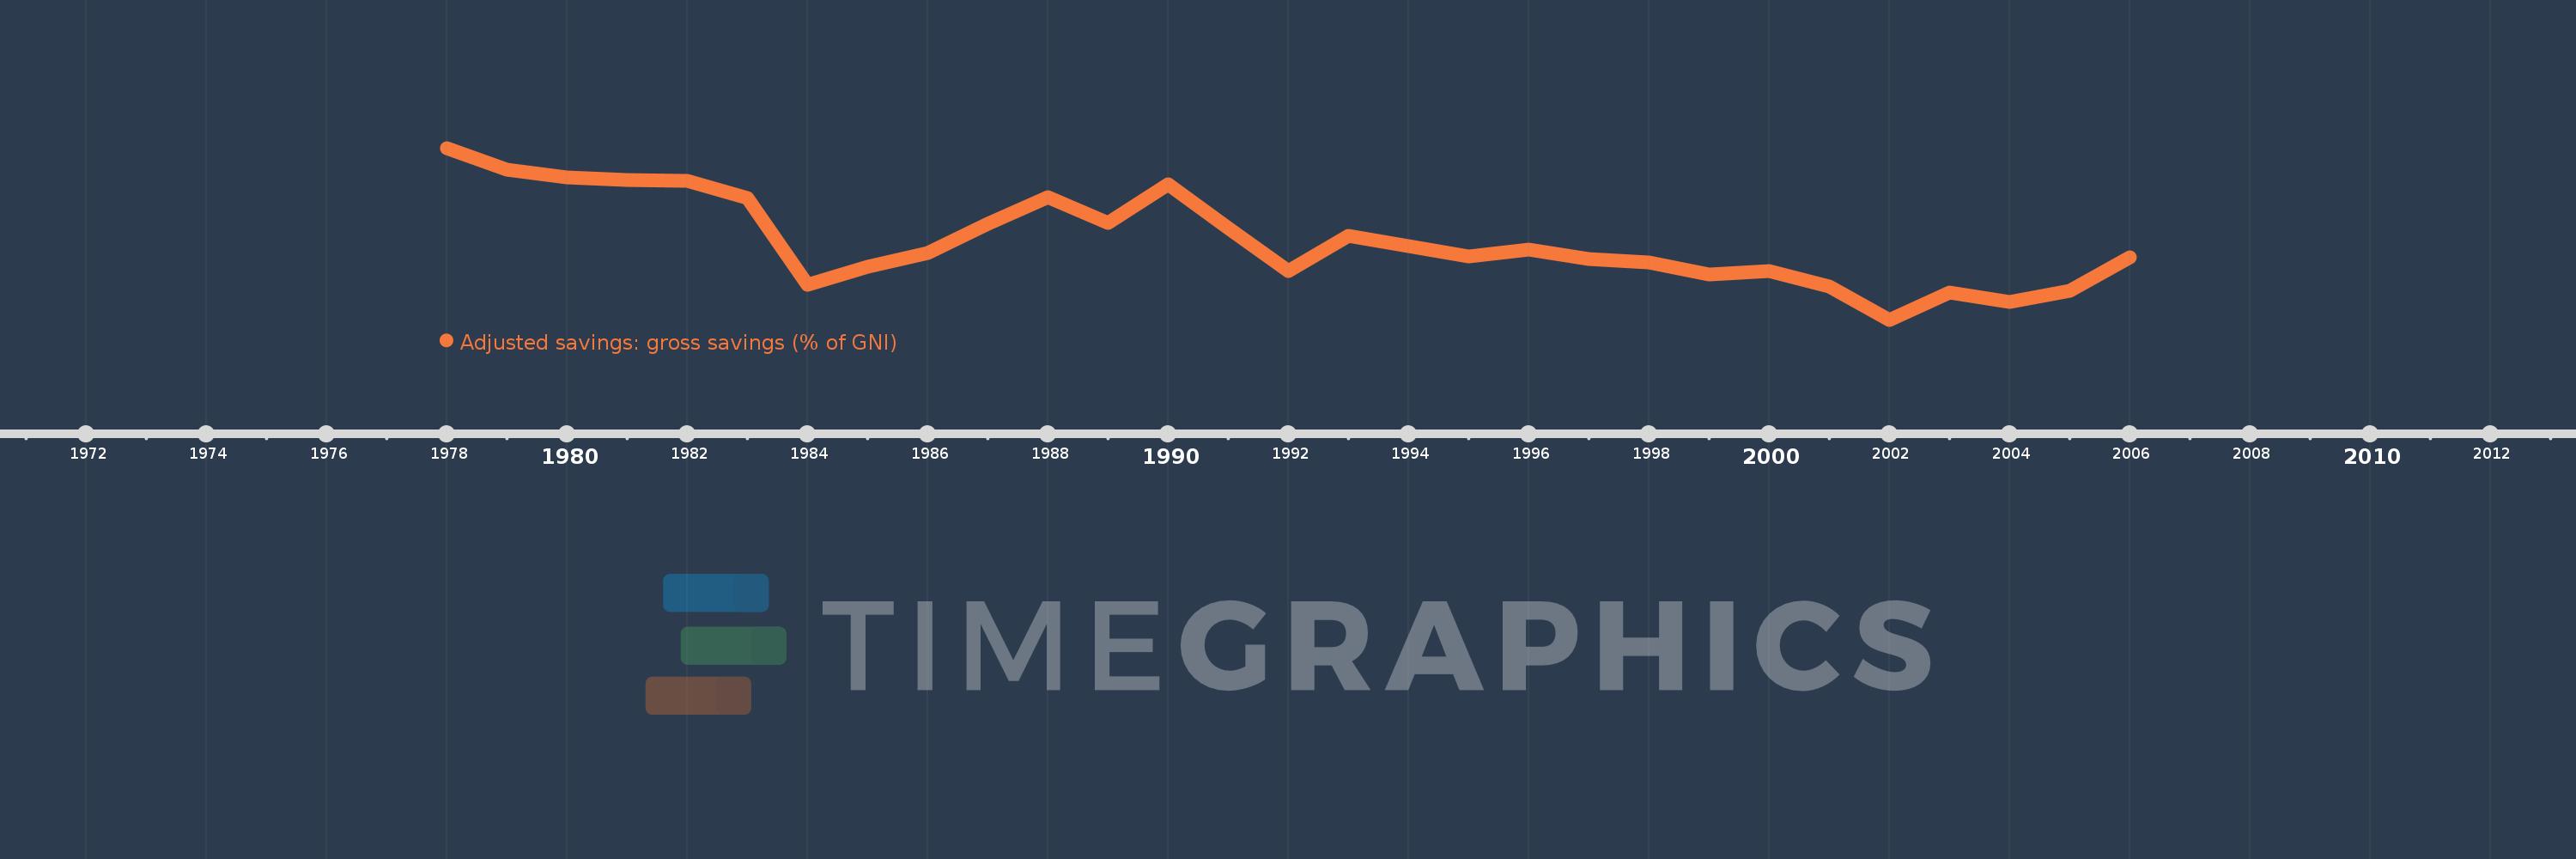
Adjusted savings: gross savings (% of GNI)
2006,2005,2004,2003,2002,2001,2000,1999,1998,1997,1996,1995,1993,1992,1991,1990,1989,1988,1987,1986,1985,1984,1983,1982,1981,1980,1979,1978