33
/pt/
AIzaSyAYiBZKx7MnpbEhh9jyipgxe19OcubqV5w
August 1, 2025
246025
South Africa
ZAF
true
2
1
Newborns protected against tetanus (%)
2016,2015,2014,2013,2012,2011,2010,2009,2008,2007,2006,2005,2004,2003,2002,2001,2000,1999,1998,1997,1996,1995,1994,1993
Download
Biblioteca de estatísticas globais →South Africa →

Newborns protected against tetanus (%)

Estas estatísticas em outros países:

AfghanistanAlbaniaAlgeriaAngolaArab WorldBahamas, TheBahrainBangladeshBelizeBeninBhutanBoliviaBotswanaBrazilBrunei DarussalamBurkina FasoBurundiCabo VerdeCambodiaCameroonCaribbean small statesCentral African RepublicChadColombiaComorosCongo, Dem. Rep.Congo, Rep.Cote d'IvoireDjiboutiDominican RepublicEarly-demographic dividendEcuadorEgypt, Arab Rep.El SalvadorEquatorial GuineaEritreaEthiopiaFijiFragile and conflict affected situationsGabonGambia, TheGhanaGuatemalaGuineaGuinea-BissauGuyanaHaitiHeavily indebted poor countries (HIPC)HondurasIDA & IBRD totalIDA blendIDA onlyIDA totalIndiaIndonesiaIran, Islamic Rep.IraqJamaicaJordanKenyaKiribatiKorea, Dem. People’s Rep.KuwaitLao PDRLatin America & Caribbean Latin America & Caribbean (excluding high income)Latin America & the Caribbean (IDA & IBRD countries)Least developed countries: UN classificationLesothoLiberiaLow & middle incomeLow incomeLower middle incomeMadagascarMalawiMalaysiaMaldivesMaliMauritaniaMauritiusMexicoMiddle East & North AfricaMiddle East & North Africa (excluding high income)Middle East & North Africa (IDA & IBRD countries)Middle incomeMoroccoMozambiqueMyanmarNamibiaNepalNicaraguaNigerNigeriaOmanOther small statesPacific island small statesPakistanPapua New GuineaParaguayPeruPhilippinesPre-demographic dividendRwandaSao Tome and PrincipeSenegalSeychellesSierra LeoneSmall statesSolomon IslandsSomaliaSouth AfricaSouth AsiaSouth Asia (IDA & IBRD)South SudanSri LankaSub-Saharan Africa Sub-Saharan Africa (excluding high income)Sub-Saharan Africa (IDA & IBRD countries)SudanSurinameSwazilandSyrian Arab RepublicTanzaniaThailandTimor-LesteTogoTunisiaTurkeyUgandaVanuatuVenezuela, RBVietnamYemen, Rep.ZambiaZimbabwe

Linha do tempo:

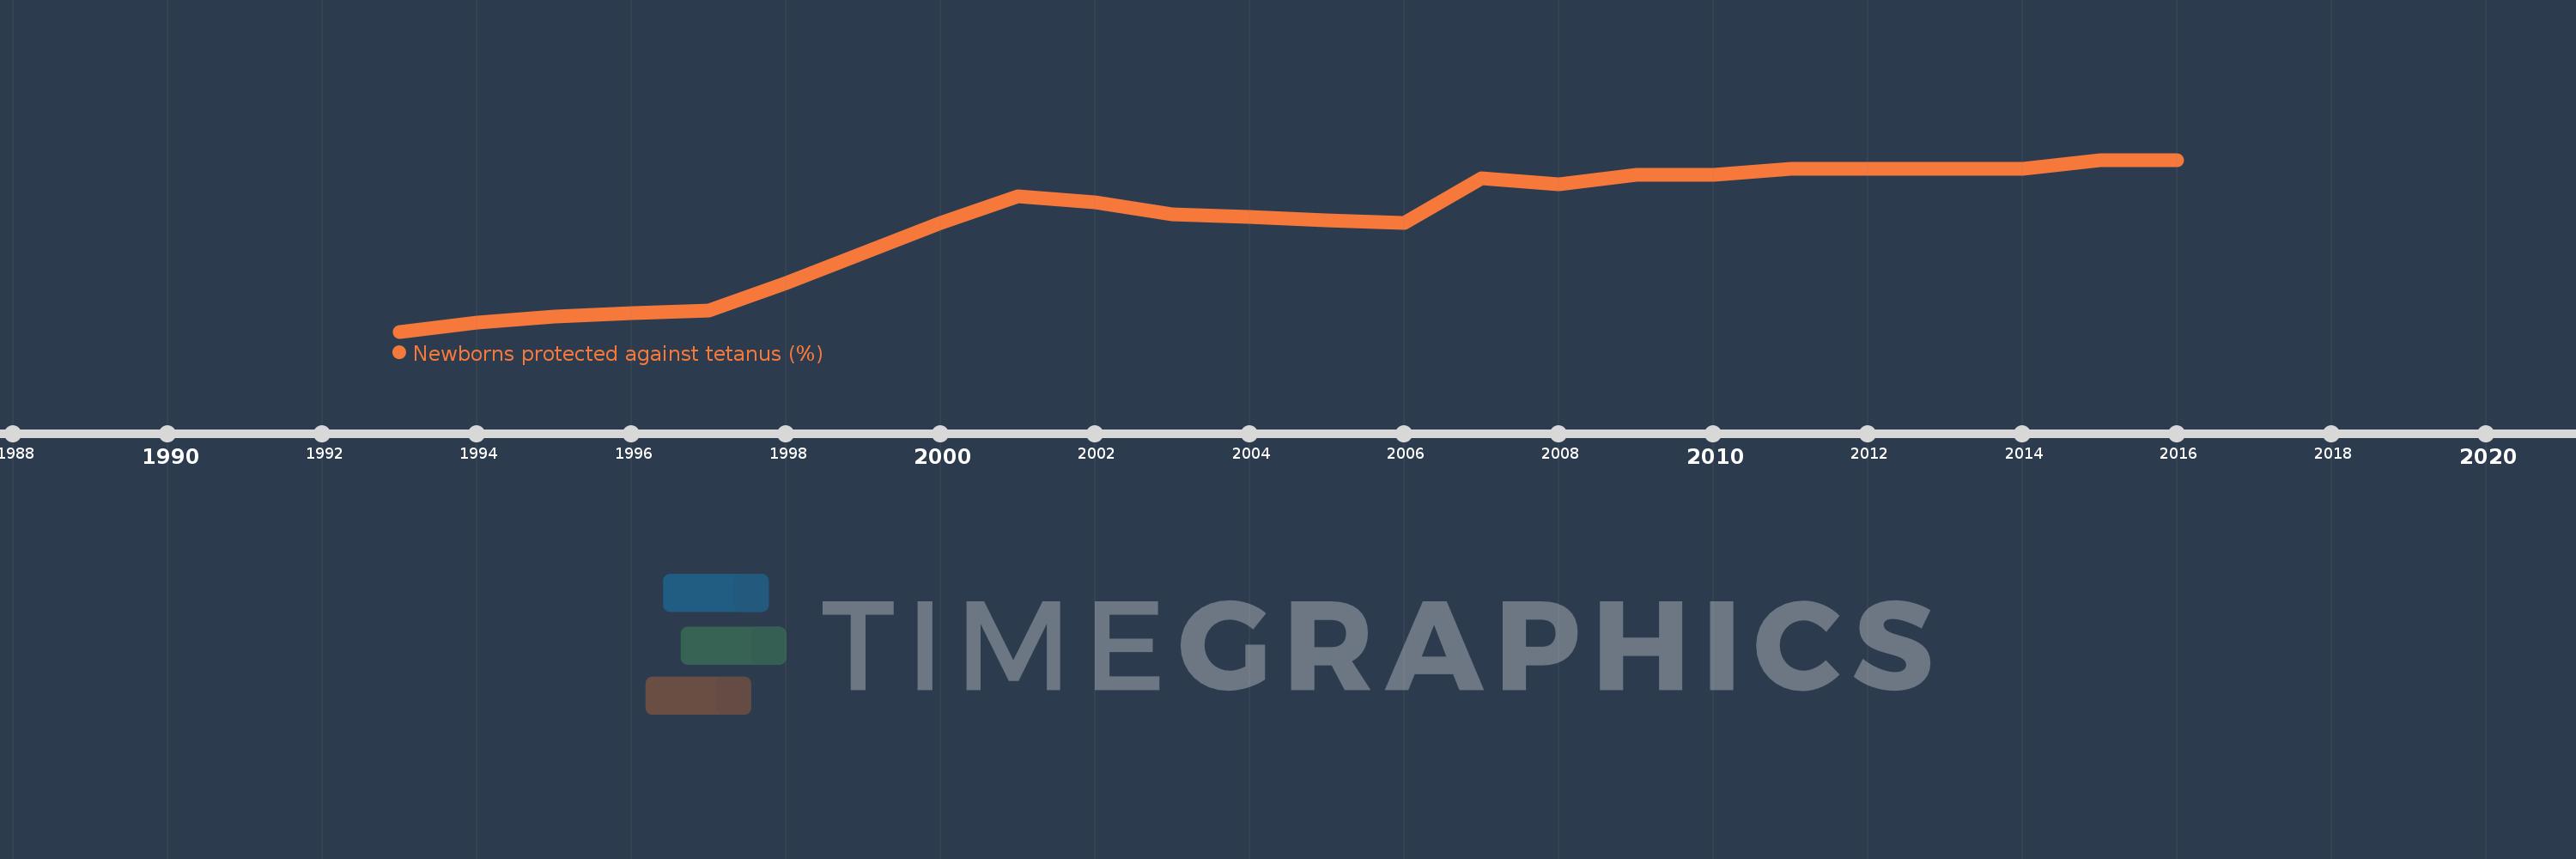
Nesta escala de tempo está apresentado um gráfico de 1993 ano até 2016 ano South Africa. Dados de 1992 ano ausente. O número de observações reais por data: 24.

Fonte (nome):

Indicadores de desenvolvimento mundial

Fonte (organização):

WHO and UNICEF (http://www.who.int/immunization/monitoring_surveillance/en/).

Categorias:

Health

Foi atualizado:

23 abr 2017 ano

Indicadores de alterações dos valores ao longo dos anos

Em média:
59.292
Mínimo:
23.0
1 jan 1993 ano
Máximo:
80.0
1 jan 2015 ano
Na data de observação
Valor
Mudança absoluta
A alteração em relação ao valor anterior
1 jan 1993 ano
23.0
+23.0
0.0%
1 jan 1994 ano
26.0
+3.0
13.04%
1 jan 1995 ano
28.0
+2.0
7.69%
1 jan 1996 ano
29.0
+1.0
3.57%
1 jan 1997 ano
30.0
+1.0
3.45%
1 jan 1998 ano
39.0
+9.0
30.0%
1 jan 1999 ano
49.0
+10.0
25.64%
1 jan 2000 ano
59.0
+10.0
20.41%
1 jan 2001 ano
68.0
+9.0
15.25%
1 jan 2002 ano
66.0
-2.0
-2.94%
1 jan 2003 ano
62.0
-4.0
-6.06%
1 jan 2004 ano
61.0
-1.0
-1.61%
1 jan 2005 ano
60.0
-1.0
-1.64%
1 jan 2006 ano
59.0
-1.0
-1.67%
1 jan 2007 ano
74.0
+15.0
25.42%
1 jan 2008 ano
72.0
-2.0
-2.7%
1 jan 2009 ano
75.0
+3.0
4.17%
1 jan 2010 ano
75.0
0.0
0.0%
1 jan 2011 ano
77.0
+2.0
2.67%
1 jan 2012 ano
77.0
0.0
0.0%
1 jan 2013 ano
77.0
0.0
0.0%
1 jan 2014 ano
77.0
0.0
0.0%
1 jan 2015 ano
80.0
+3.0
3.9%
1 jan 2016 ano
80.0
0.0
0.0%

Classificação de países por estatísticas atuais por anos