30
/pt/
AIzaSyAYiBZKx7MnpbEhh9jyipgxe19OcubqV5w
April 1, 2024
243125
Slovenia
SVN
true
2
1
Services, etc., value added (annual % growth)
2016,2015,2014,2013,2012,2011,2010,2009,2008,2007,2006,2005,2004,2003,2002,2001,2000,1999,1998,1997
Download
Biblioteca de estatísticas globais →Slovenia →

Services, etc., value added (annual % growth)

Estas estatísticas em outros países:

AfghanistanAlbaniaAlgeriaAntigua and BarbudaArab WorldArgentinaArmeniaAustraliaAustriaAzerbaijanBahamas, TheBahrainBangladeshBelarusBelgiumBelizeBeninBermudaBhutanBoliviaBosnia and HerzegovinaBotswanaBrazilBrunei DarussalamBulgariaBurkina FasoBurundiCabo VerdeCambodiaCameroonCanadaCaribbean small statesCentral African RepublicCentral Europe and the BalticsChadChileChinaColombiaComorosCongo, Dem. Rep.Congo, Rep.Costa RicaCote d'IvoireCroatiaCubaCyprusCzech RepublicDenmarkDjiboutiDominicaDominican RepublicEarly-demographic dividendEast Asia & PacificEast Asia & Pacific (excluding high income)East Asia & Pacific (IDA & IBRD countries)EcuadorEgypt, Arab Rep.El SalvadorEquatorial GuineaEritreaEstoniaEthiopiaEuro areaEurope & Central AsiaEurope & Central Asia (excluding high income)Europe & Central Asia (IDA & IBRD countries)European UnionFijiFinlandFragile and conflict affected situationsFranceGabonGambia, TheGeorgiaGermanyGhanaGreeceGrenadaGuatemalaGuineaGuinea-BissauGuyanaHaitiHeavily indebted poor countries (HIPC)High incomeHondurasHong Kong SAR, ChinaHungaryIBRD onlyIcelandIDA & IBRD totalIDA blendIDA onlyIDA totalIndiaIndonesiaIran, Islamic Rep.IraqIrelandItalyJamaicaJapanJordanKazakhstanKenyaKiribatiKorea, Rep.KosovoKuwaitKyrgyz RepublicLao PDRLate-demographic dividendLatin America & Caribbean Latin America & Caribbean (excluding high income)Latin America & the Caribbean (IDA & IBRD countries)LatviaLeast developed countries: UN classificationLebanonLesothoLiberiaLithuaniaLow & middle incomeLow incomeLower middle incomeLuxembourgMacedonia, FYRMadagascarMalawiMalaysiaMaldivesMaliMarshall IslandsMauritaniaMauritiusMexicoMicronesia, Fed. Sts.Middle East & North AfricaMiddle East & North Africa (excluding high income)Middle East & North Africa (IDA & IBRD countries)Middle incomeMoldovaMongoliaMontenegroMoroccoMozambiqueMyanmarNamibiaNepalNetherlandsNew ZealandNicaraguaNigerNigeriaNorth AmericaNorwayOECD membersOmanOther small statesPacific island small statesPakistanPalauPanamaPapua New GuineaParaguayPeruPhilippinesPolandPortugalPost-demographic dividendPre-demographic dividendPuerto RicoQatarRomaniaRussian FederationRwandaSamoaSao Tome and PrincipeSaudi ArabiaSenegalSerbiaSeychellesSierra LeoneSingaporeSlovak RepublicSloveniaSmall statesSolomon IslandsSomaliaSouth AfricaSouth AsiaSouth Asia (IDA & IBRD)SpainSri LankaSt. Kitts and NevisSt. LuciaSt. Vincent and the GrenadinesSub-Saharan Africa Sub-Saharan Africa (excluding high income)Sub-Saharan Africa (IDA & IBRD countries)SudanSurinameSwazilandSwedenSwitzerlandSyrian Arab RepublicTajikistanTanzaniaThailandTimor-LesteTogoTongaTrinidad and TobagoTunisiaTurkeyTurkmenistanTuvaluUgandaUkraineUnited Arab EmiratesUnited KingdomUnited StatesUpper middle incomeUruguayUzbekistanVanuatuVenezuela, RBVietnamWest Bank and GazaWorldZambiaZimbabwe

Linha do tempo:

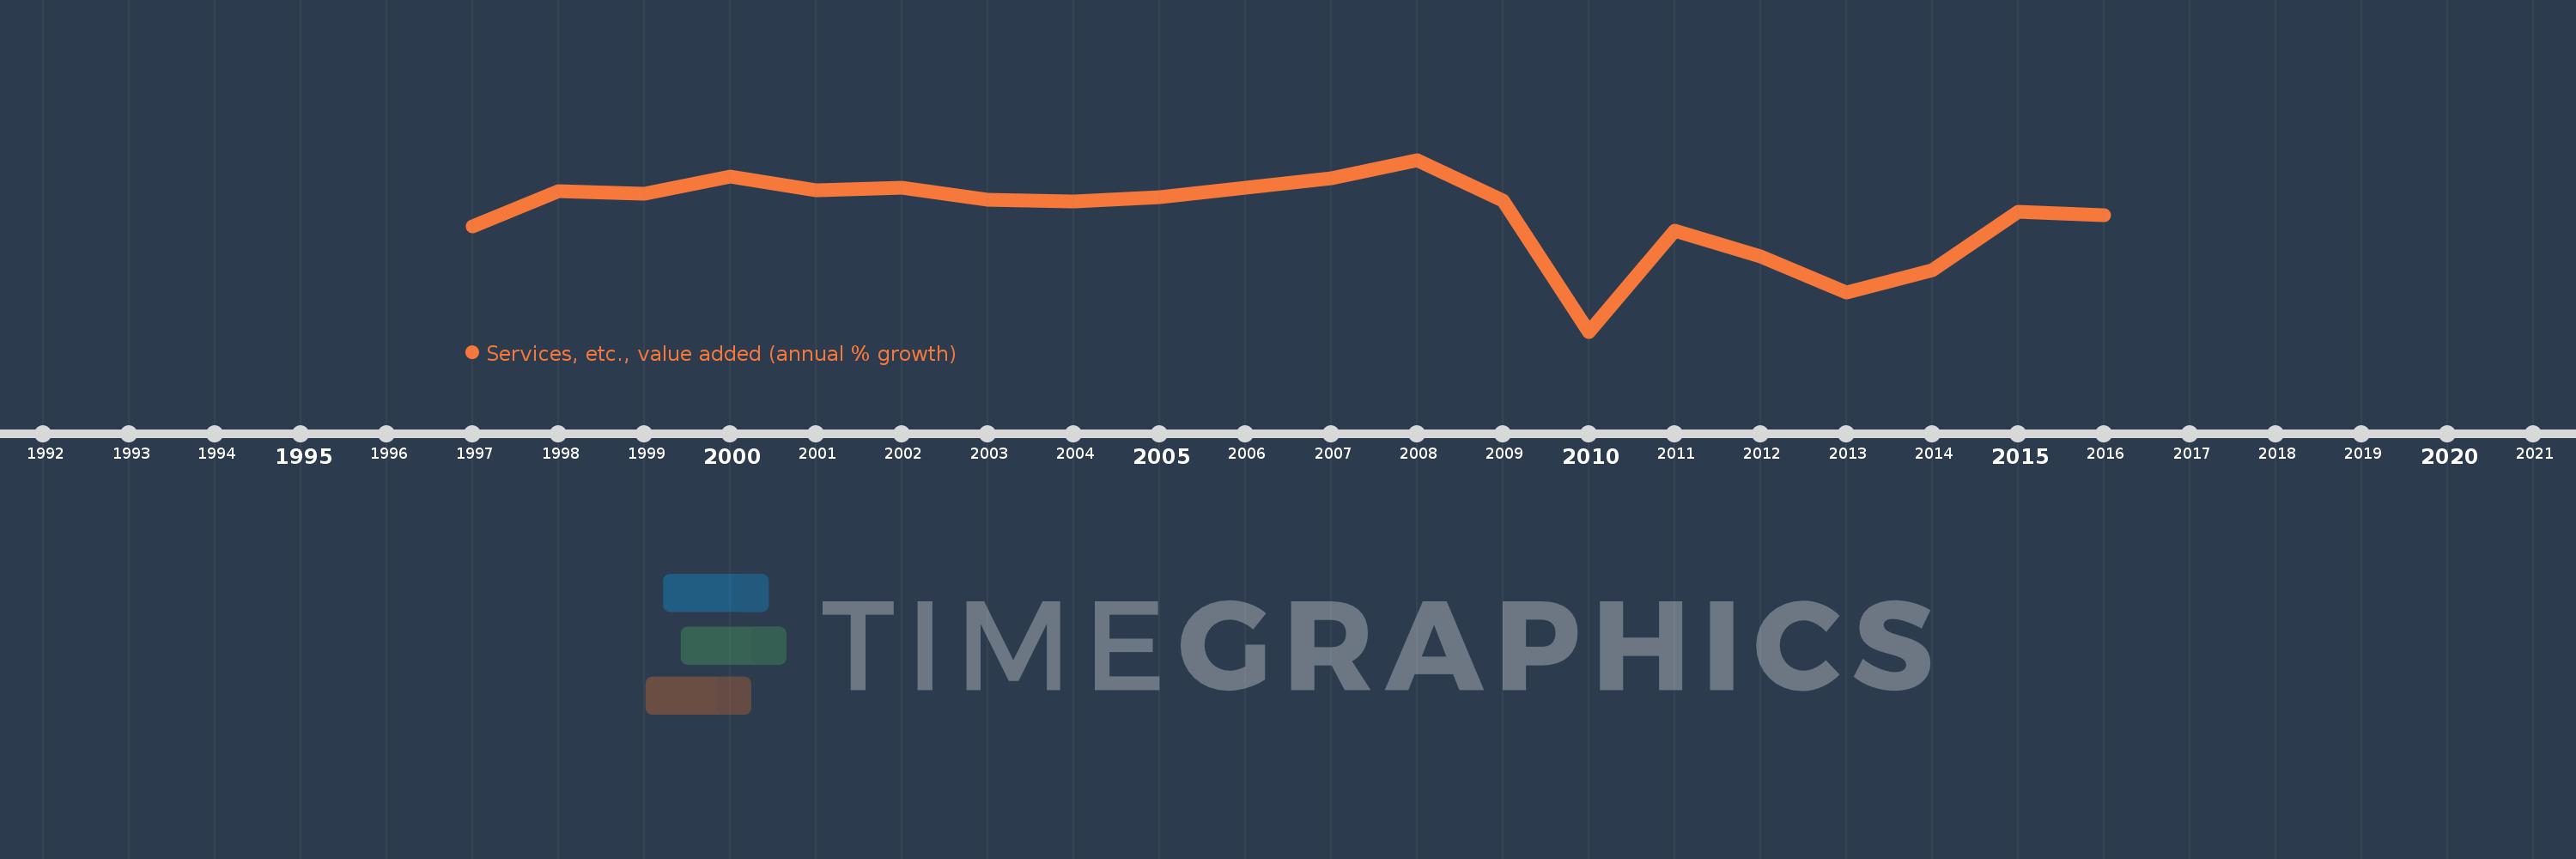
Nesta escala de tempo está apresentado um gráfico de 1997 ano até 2016 ano Slovenia. Dados de 1996 ano ausente. O número de observações reais por data: 20.

Fonte (nome):

Indicadores de desenvolvimento mundial

Fonte (organização):

World Bank national accounts data, and OECD National Accounts data files.

Categorias:

Economy & Growth

Foi atualizado:

23 abr 2017 ano

Indicadores de alterações dos valores ao longo dos anos

Em média:
2.703
Mínimo:
-3.806
1 jan 2010 ano
Máximo:
5.774
1 jan 2008 ano
Na data de observação
Valor
Mudança absoluta
A alteração em relação ao valor anterior
1 jan 1997 ano
2.054
+2.054
0.0%
1 jan 1998 ano
4.013
+1.958
95.33%
1 jan 1999 ano
3.884
-0.129
-3.22%
1 jan 2000 ano
4.838
+0.954
24.57%
1 jan 2001 ano
4.078
-0.76
-15.71%
1 jan 2002 ano
4.233
+0.155
3.79%
1 jan 2003 ano
3.569
-0.663
-15.67%
1 jan 2004 ano
3.437
-0.132
-3.7%
1 jan 2005 ano
3.708
+0.271
7.89%
1 jan 2006 ano
4.241
+0.533
14.36%
1 jan 2007 ano
4.758
+0.517
12.19%
1 jan 2008 ano
5.774
+1.016
21.36%
1 jan 2009 ano
3.514
-2.261
-39.15%
1 jan 2010 ano
-3.806
-7.32
-208.31%
1 jan 2011 ano
1.832
+5.638
-148.13%
1 jan 2012 ano
0.391
-1.441
-78.67%
1 jan 2013 ano
-1.617
-2.008
-513.93%
1 jan 2014 ano
-0.373
+1.244
-76.92%
1 jan 2015 ano
2.859
+3.232
-865.85%
1 jan 2016 ano
2.667
-0.192
-6.7%

Classificação de países por estatísticas atuais por anos