33
/pt/
AIzaSyAYiBZKx7MnpbEhh9jyipgxe19OcubqV5w
August 1, 2025
231495
Rwanda
RWA
true
2
1
Patent applications, nonresidents
2015,2013,2000,1995,1993,1992,1991,1990,1989,1988,1987,1986,1985,1984,1983,1982,1981,1980,1979,1978,1977,1976,1975,1974,1973,1972,1969
Download
Biblioteca de estatísticas globais →Rwanda →

Patent applications, nonresidents

Estas estatísticas em outros países:

AlbaniaAlgeriaAngolaAntigua and BarbudaArab WorldArgentinaArmeniaAustraliaAustriaAzerbaijanBahamas, TheBahrainBangladeshBarbadosBelarusBelgiumBelizeBhutanBoliviaBosnia and HerzegovinaBotswanaBrazilBrunei DarussalamBulgariaBurundiCambodiaCanadaCaribbean small statesCentral Europe and the BalticsChileChinaColombiaCongo, Dem. Rep.Congo, Rep.Costa RicaCote d'IvoireCroatiaCubaCyprusCzech RepublicDenmarkDjiboutiDominicaDominican RepublicEarly-demographic dividendEast Asia & PacificEast Asia & Pacific (excluding high income)East Asia & Pacific (IDA & IBRD countries)EcuadorEgypt, Arab Rep.El SalvadorEstoniaEthiopiaEuro areaEurope & Central AsiaEurope & Central Asia (excluding high income)Europe & Central Asia (IDA & IBRD countries)European UnionFijiFinlandFranceGambia, TheGeorgiaGermanyGhanaGreeceGrenadaGuatemalaGuyanaHaitiHigh incomeHondurasHong Kong SAR, ChinaHungaryIBRD onlyIcelandIDA & IBRD totalIDA blendIndiaIndonesiaIran, Islamic Rep.IraqIrelandIsraelItalyJamaicaJapanJordanKazakhstanKenyaKiribatiKorea, Dem. People’s Rep.Korea, Rep.KuwaitKyrgyz RepublicLao PDRLate-demographic dividendLatin America & Caribbean Latin America & Caribbean (excluding high income)Latin America & the Caribbean (IDA & IBRD countries)LatviaLebanonLesothoLiberiaLibyaLithuaniaLow & middle incomeLower middle incomeLuxembourgMacao SAR, ChinaMacedonia, FYRMadagascarMalawiMalaysiaMaliMaltaMauritiusMexicoMiddle East & North AfricaMiddle East & North Africa (excluding high income)Middle East & North Africa (IDA & IBRD countries)Middle incomeMoldovaMonacoMongoliaMontenegroMoroccoMozambiqueNamibiaNepalNetherlandsNew ZealandNicaraguaNigeriaNorth AmericaNorwayOECD membersPacific island small statesPakistanPanamaPapua New GuineaParaguayPeruPhilippinesPolandPortugalPost-demographic dividendQatarRomaniaRussian FederationRwandaSamoaSao Tome and PrincipeSaudi ArabiaSerbiaSeychellesSierra LeoneSingaporeSlovak RepublicSloveniaSolomon IslandsSomaliaSouth AfricaSouth AsiaSouth Asia (IDA & IBRD)SpainSri LankaSt. LuciaSt. Vincent and the GrenadinesSudanSwazilandSwedenSwitzerlandSyrian Arab RepublicTajikistanTanzaniaThailandTrinidad and TobagoTunisiaTurkeyTurkmenistanUgandaUkraineUnited Arab EmiratesUnited KingdomUnited StatesUpper middle incomeUruguayUzbekistanVenezuela, RBVietnamWorldYemen, Rep.ZambiaZimbabwe

Linha do tempo:

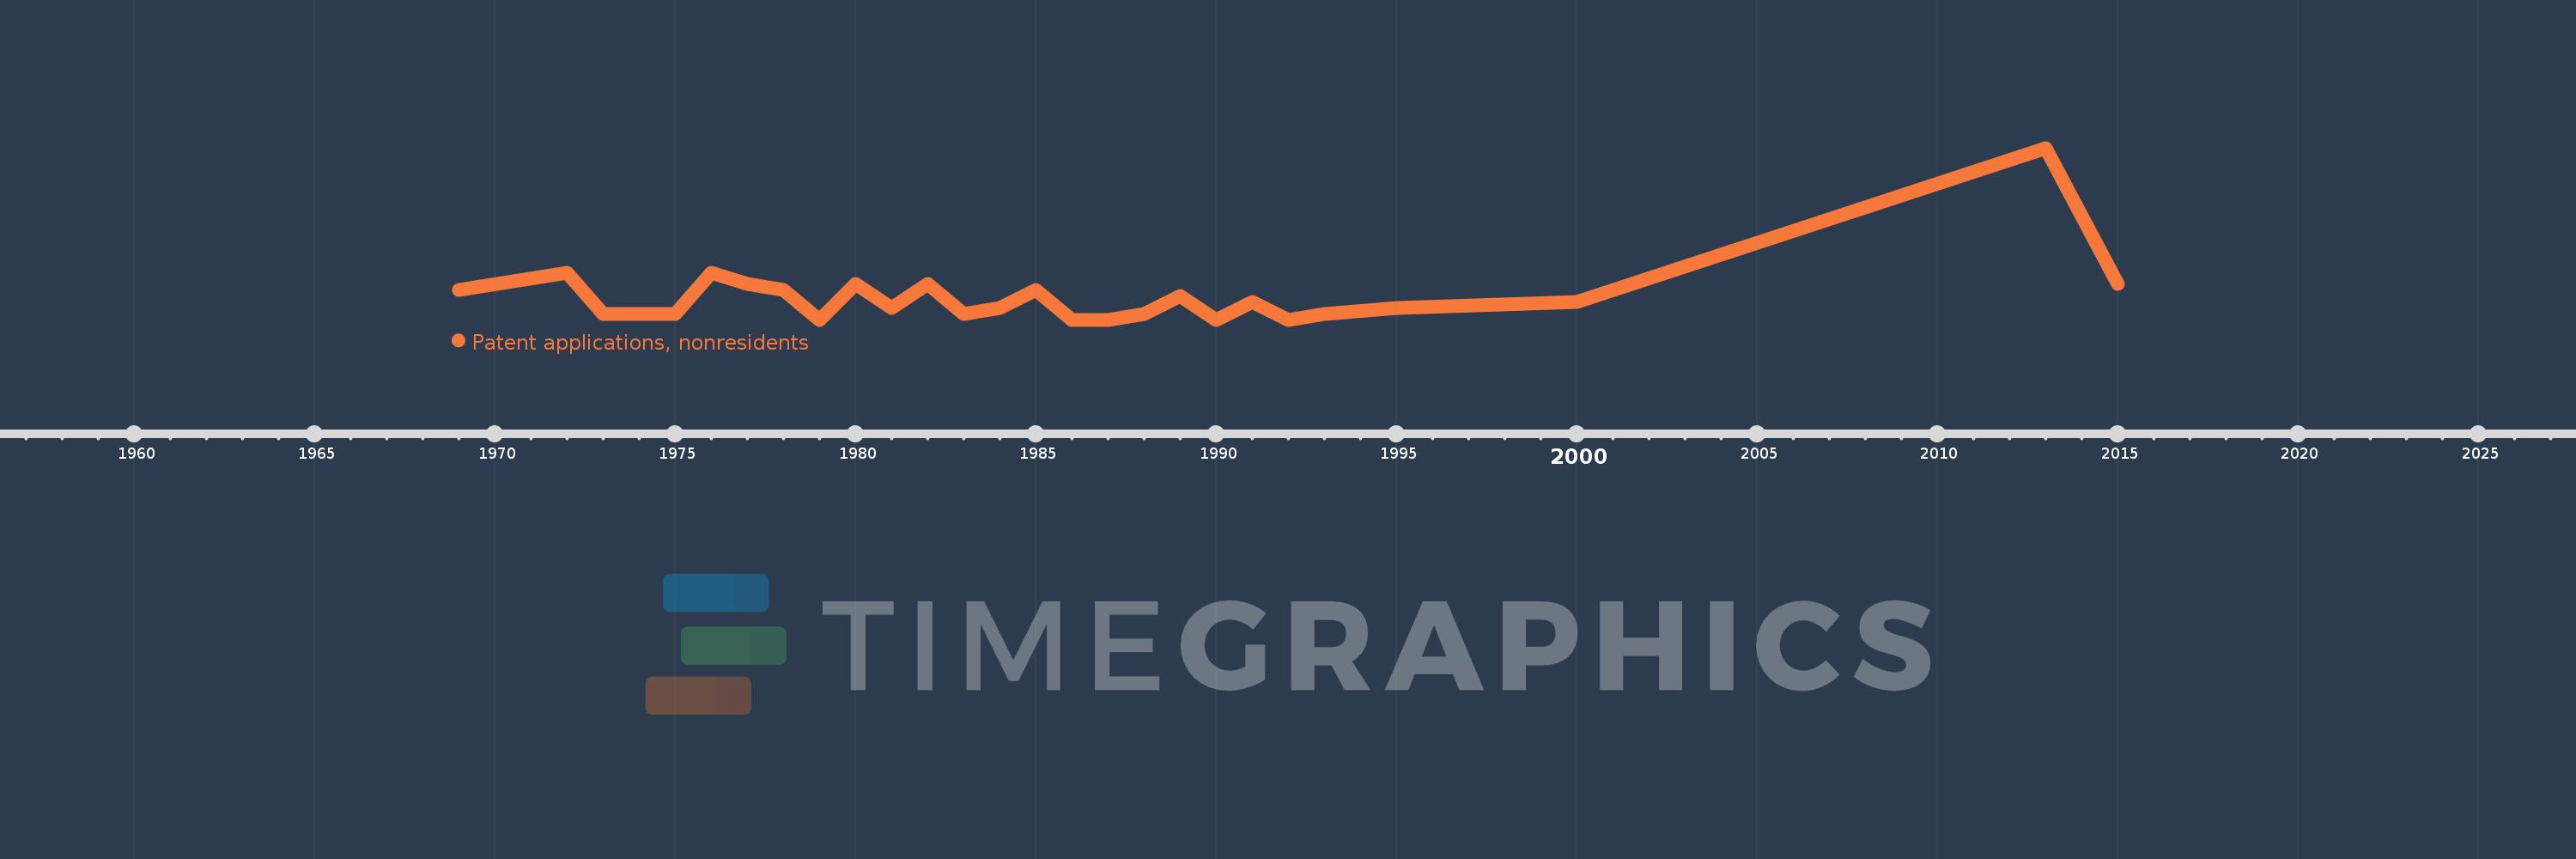
Nesta escala de tempo está apresentado um gráfico de 1969 ano até 2015 ano Rwanda. Dados de 1968 ano ausente. O número de observações reais por data: 27.

Fonte (nome):

Indicadores de desenvolvimento mundial

Fonte (organização):

World Intellectual Property Organization (WIPO), WIPO Patent Report: Statistics on Worldwide Patent Activity. The International Bureau of WIPO assumes no responsibility with respect to the transformation of these data.

Categorias:

Science & Technology

Foi atualizado:

23 abr 2017 ano

Indicadores de alterações dos valores ao longo dos anos

Em média:
4.926
Mínimo:
1.0
1 jan 1979 ano
Máximo:
30.0
1 jan 2013 ano
Na data de observação
Valor
Mudança absoluta
A alteração em relação ao valor anterior
1 jan 1969 ano
6.0
+6.0
0.0%
1 jan 1972 ano
9.0
+3.0
50.0%
1 jan 1973 ano
2.0
-7.0
-77.78%
1 jan 1974 ano
2.0
0.0
0.0%
1 jan 1975 ano
2.0
0.0
0.0%
1 jan 1976 ano
9.0
+7.0
350.0%
1 jan 1977 ano
7.0
-2.0
-22.22%
1 jan 1978 ano
6.0
-1.0
-14.29%
1 jan 1979 ano
1.0
-5.0
-83.33%
1 jan 1980 ano
7.0
+6.0
600.0%
1 jan 1981 ano
3.0
-4.0
-57.14%
1 jan 1982 ano
7.0
+4.0
133.33%
1 jan 1983 ano
2.0
-5.0
-71.43%
1 jan 1984 ano
3.0
+1.0
50.0%
1 jan 1985 ano
6.0
+3.0
100.0%
1 jan 1986 ano
1.0
-5.0
-83.33%
1 jan 1987 ano
1.0
0.0
0.0%
1 jan 1988 ano
2.0
+1.0
100.0%
1 jan 1989 ano
5.0
+3.0
150.0%
1 jan 1990 ano
1.0
-4.0
-80.0%
1 jan 1991 ano
4.0
+3.0
300.0%
1 jan 1992 ano
1.0
-3.0
-75.0%
1 jan 1993 ano
2.0
+1.0
100.0%
1 jan 1995 ano
3.0
+1.0
50.0%
1 jan 2000 ano
4.0
+1.0
33.33%
1 jan 2013 ano
30.0
+26.0
650.0%
1 jan 2015 ano
7.0
-23.0
-76.67%

Classificação de países por estatísticas atuais por anos