29
/pt/
pt
AIzaSyAYiBZKx7MnpbEhh9jyipgxe19OcubqV5w
April 1, 2024
228921
Romania
ROU
true
2
1
Oil rents (% of GDP)
2016,2015,2014,2013,2012,2011,2010,2009,2008,2007,2006,2005,2004,2003,2002,2001,2000,1999,1998,1997,1996,1995,1994,1993,1992,1991,1990,1989,1988
Download
Biblioteca de estatísticas globais →Romania →

Oil rents (% of GDP)

Estas estatísticas em outros países:
AfghanistanAlbaniaAlgeriaAngolaArab WorldArgentinaArmeniaAustraliaAustriaAzerbaijanBahrainBangladeshBarbadosBelarusBelgiumBelizeBeninBoliviaBosnia and HerzegovinaBotswanaBrazilBrunei DarussalamBulgariaCambodiaCameroonCanadaCaribbean small statesCentral Europe and the BalticsChadChileChinaColombiaCongo, Dem. Rep.Congo, Rep.Costa RicaCote d'IvoireCroatiaCubaCyprusCzech RepublicDenmarkDominican RepublicEarly-demographic dividendEast Asia & PacificEast Asia & Pacific (excluding high income)East Asia & Pacific (IDA & IBRD countries)EcuadorEgypt, Arab Rep.El SalvadorEquatorial GuineaEritreaEstoniaEthiopiaEuro areaEurope & Central AsiaEurope & Central Asia (excluding high income)Europe & Central Asia (IDA & IBRD countries)European UnionFinlandFragile and conflict affected situationsFranceGabonGeorgiaGermanyGhanaGreeceGuatemalaHaitiHeavily indebted poor countries (HIPC)High incomeHondurasHungaryIBRD onlyIcelandIDA & IBRD totalIDA blendIDA onlyIDA totalIndiaIndonesiaIran, Islamic Rep.IraqIrelandIsraelItalyJamaicaJapanJordanKazakhstanKenyaKorea, Rep.KosovoKuwaitKyrgyz RepublicLate-demographic dividendLatin America & Caribbean Latin America & Caribbean (excluding high income)Latin America & the Caribbean (IDA & IBRD countries)LatviaLeast developed countries: UN classificationLebanonLibyaLithuaniaLow & middle incomeLower middle incomeLuxembourgMacedonia, FYRMalaysiaMaltaMauritaniaMauritiusMexicoMiddle East & North AfricaMiddle East & North Africa (excluding high income)Middle East & North Africa (IDA & IBRD countries)Middle incomeMongoliaMontenegroMoroccoMozambiqueMyanmarNamibiaNepalNetherlandsNew ZealandNicaraguaNigerNigeriaNorth AmericaNorwayOECD membersOmanOther small statesPakistanPanamaPapua New GuineaParaguayPeruPhilippinesPolandPortugalPost-demographic dividendPre-demographic dividendQatarRomaniaRussian FederationSaudi ArabiaSenegalSerbiaSingaporeSlovak RepublicSloveniaSmall statesSouth AfricaSouth AsiaSouth Asia (IDA & IBRD)South SudanSpainSri LankaSub-Saharan Africa Sub-Saharan Africa (excluding high income)Sub-Saharan Africa (IDA & IBRD countries)SudanSurinameSwedenSwitzerlandSyrian Arab RepublicTajikistanThailandTimor-LesteTogoTrinidad and TobagoTunisiaTurkeyTurkmenistanUkraineUnited Arab EmiratesUnited KingdomUnited StatesUpper middle incomeUruguayUzbekistanVenezuela, RBVietnamWest Bank and GazaWorldYemen, Rep.ZambiaZimbabwe
Linha do tempo:
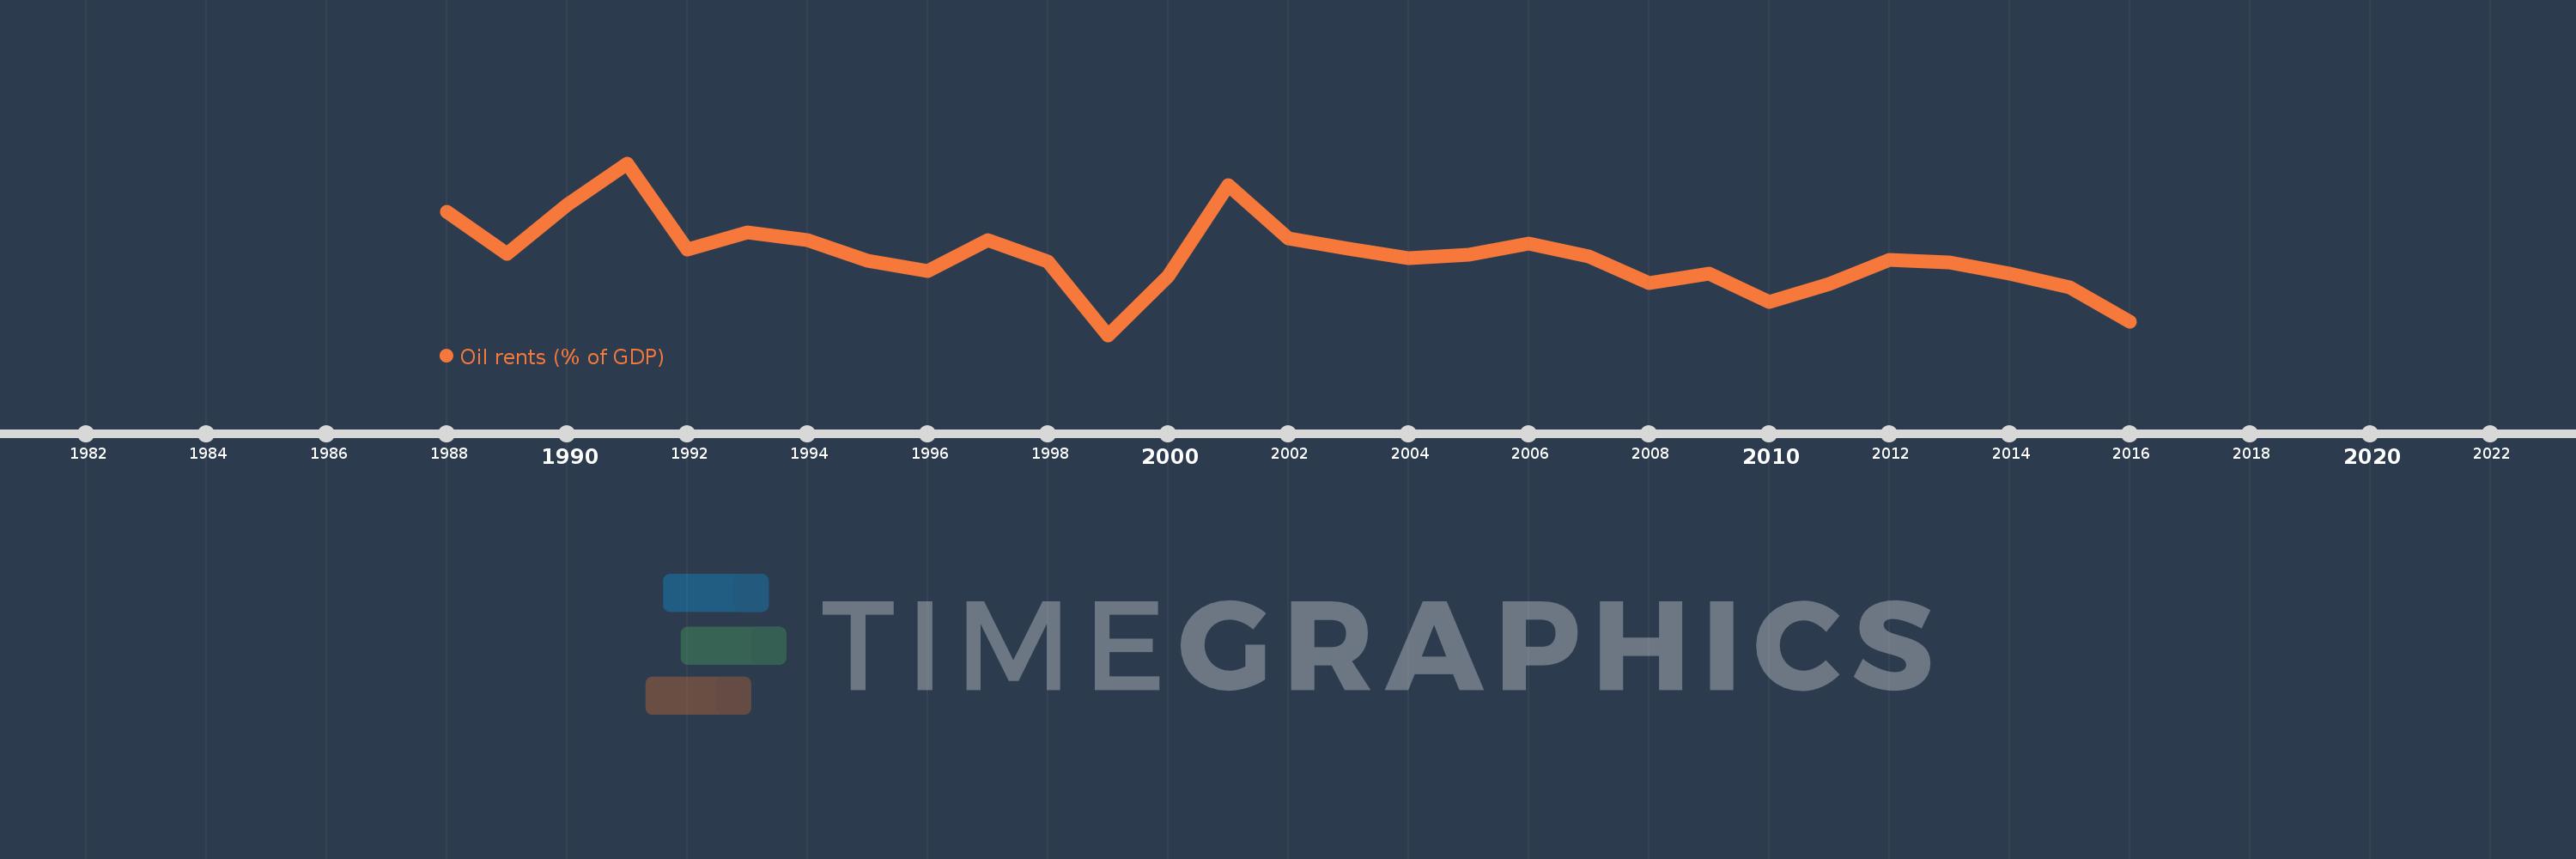
Nesta escala de tempo está apresentado um gráfico de 1988 ano até 2016 ano Romania. Dados de 1987 ano ausente. O número de observações reais por data: 29.
Fonte (nome):
Indicadores de desenvolvimento mundial
Fonte (organização):
Estimates based on sources and methods described in "The Changing Wealth of Nations: Measuring Sustainable Development in the New Millennium" (World Bank, 2011).
Categorias:
Energy & Mining, Environment
Foi atualizado:
23 abr 2017 ano
Indicadores de alterações dos valores ao longo dos anos
Em média:
1.097
Mínimo:
0.182
1 jan 1999 ano
Máximo:
2.18
1 jan 1991 ano
Na data de observação
Valor
Mudança absoluta
A alteração em relação ao valor anterior
1 jan 1988 ano
1.613
+1.613
0.0%
1 jan 1989 ano
1.127
-0.486
-30.15%
1 jan 1990 ano
1.699
+0.572
50.78%
1 jan 1991 ano
2.18
+0.481
28.32%
1 jan 1992 ano
1.175
-1.005
-46.11%
1 jan 1993 ano
1.371
+0.196
16.73%
1 jan 1994 ano
1.288
-0.083
-6.07%
1 jan 1995 ano
1.044
-0.244
-18.94%
1 jan 1996 ano
0.93
-0.114
-10.93%
1 jan 1997 ano
1.287
+0.357
38.41%
1 jan 1998 ano
1.035
-0.252
-19.59%
1 jan 1999 ano
0.182
-0.853
-82.42%
1 jan 2000 ano
0.863
+0.682
374.62%
1 jan 2001 ano
1.923
+1.059
122.67%
1 jan 2002 ano
1.308
-0.615
-31.98%
1 jan 2003 ano
1.19
-0.117
-8.98%
1 jan 2004 ano
1.073
-0.117
-9.83%
1 jan 2005 ano
1.116
+0.043
4.02%
1 jan 2006 ano
1.242
+0.126
11.28%
1 jan 2007 ano
1.092
-0.151
-12.12%
1 jan 2008 ano
0.79
-0.302
-27.69%
1 jan 2009 ano
0.896
+0.107
13.53%
1 jan 2010 ano
0.566
-0.331
-36.88%
1 jan 2011 ano
0.78
+0.214
37.85%
1 jan 2012 ano
1.056
+0.276
35.34%
1 jan 2013 ano
1.029
-0.027
-2.54%
1 jan 2014 ano
0.893
-0.136
-13.21%
1 jan 2015 ano
0.74
-0.153
-17.16%
1 jan 2016 ano
0.335
-0.405
-54.71%
Classificação de países por estatísticas atuais por anos

Comentários:

Enviar
PremiumAbout & FeedbackAcordoPrivacidade
logo
© 2022 Selected Technologies LLC – Morgan Hill, California