33
/pt/
AIzaSyB4mHJ5NPEv-XzF7P6NDYXjlkCWaeKw5bc
November 1, 2025
227405
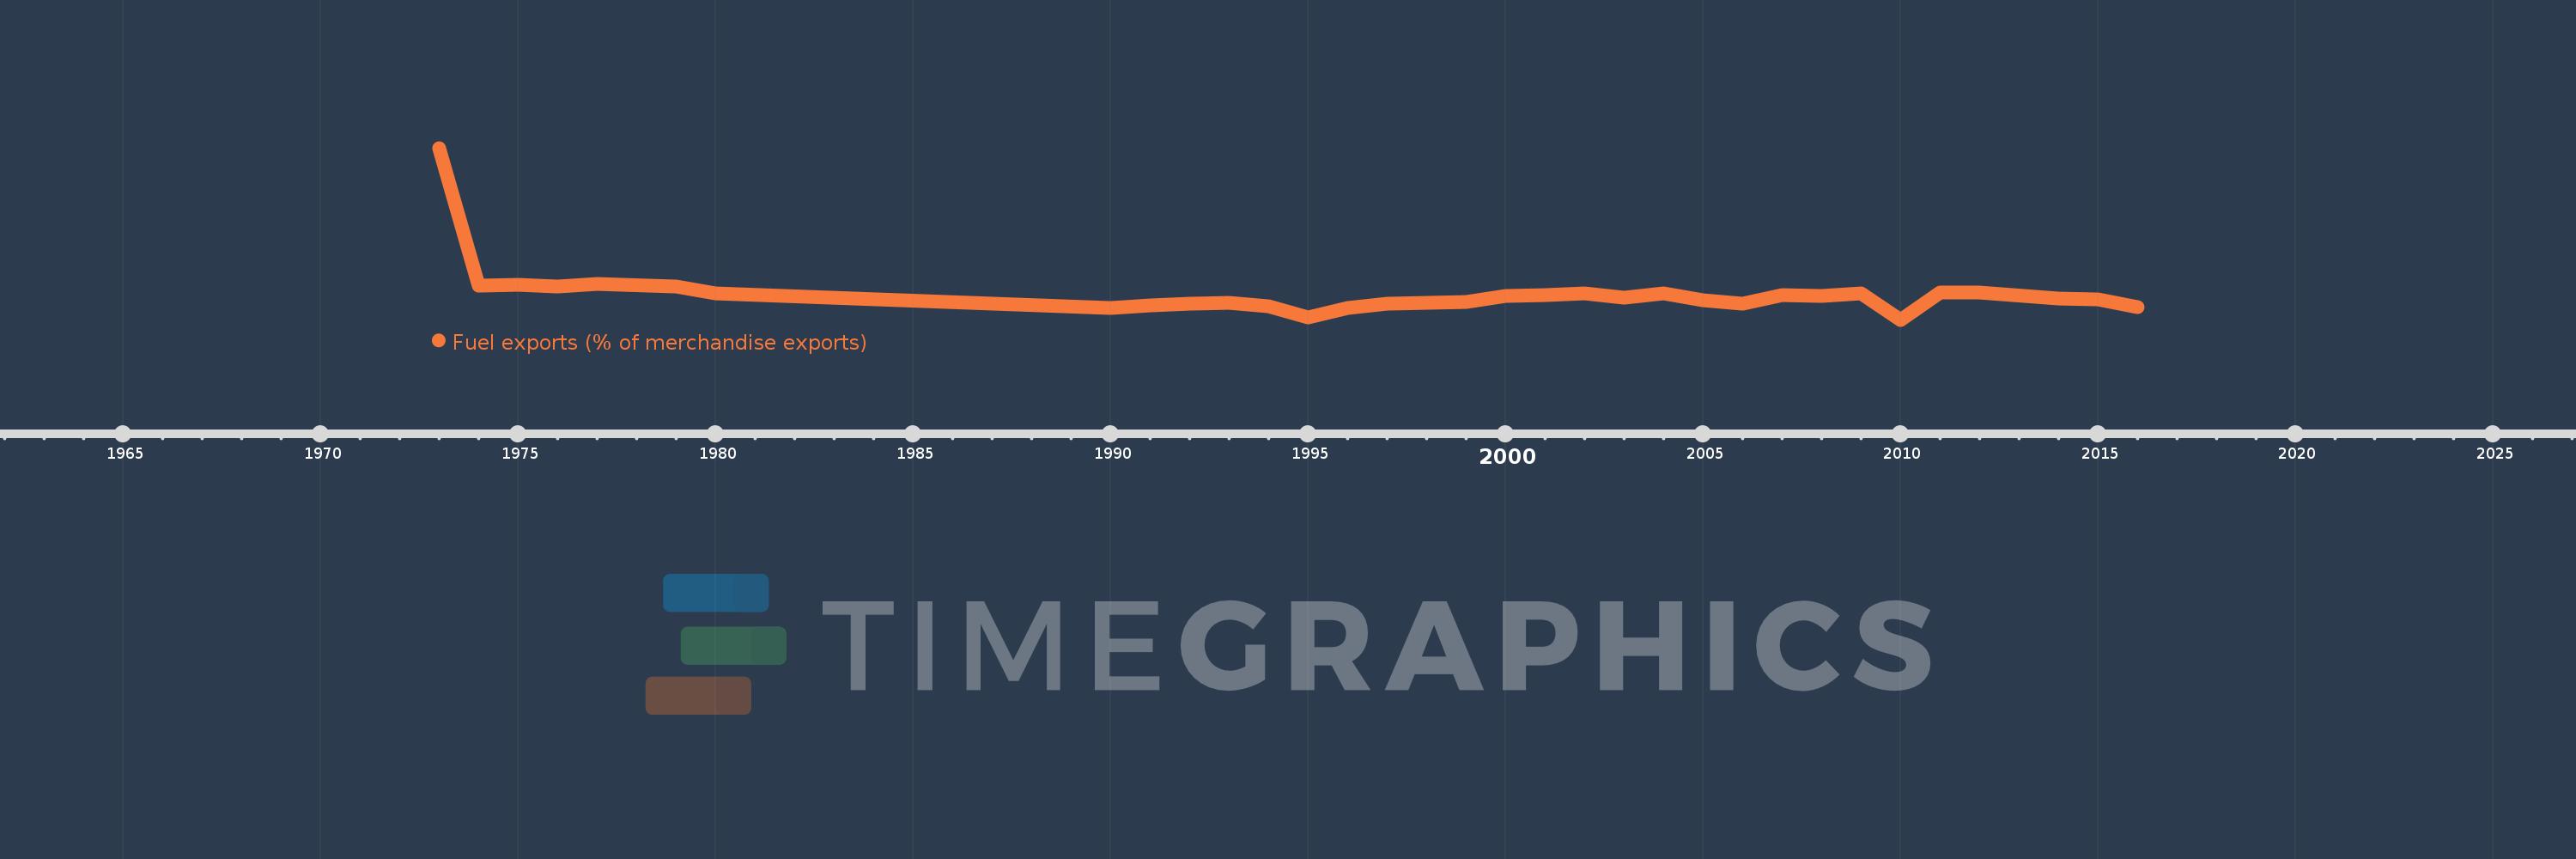
Qatar
QAT
true
2
1
Fuel exports (% of merchandise exports)
2016,2015,2014,2012,2011,2010,2009,2008,2007,2006,2005,2004,2003,2002,2001,2000,1999,1997,1996,1995,1994,1993,1992,1991,1990,1980,1979,1977,1976,1975,1974,1973