33
/pt/
AIzaSyB4mHJ5NPEv-XzF7P6NDYXjlkCWaeKw5bc
November 1, 2025
225684
Portugal
PRT
true
2
1
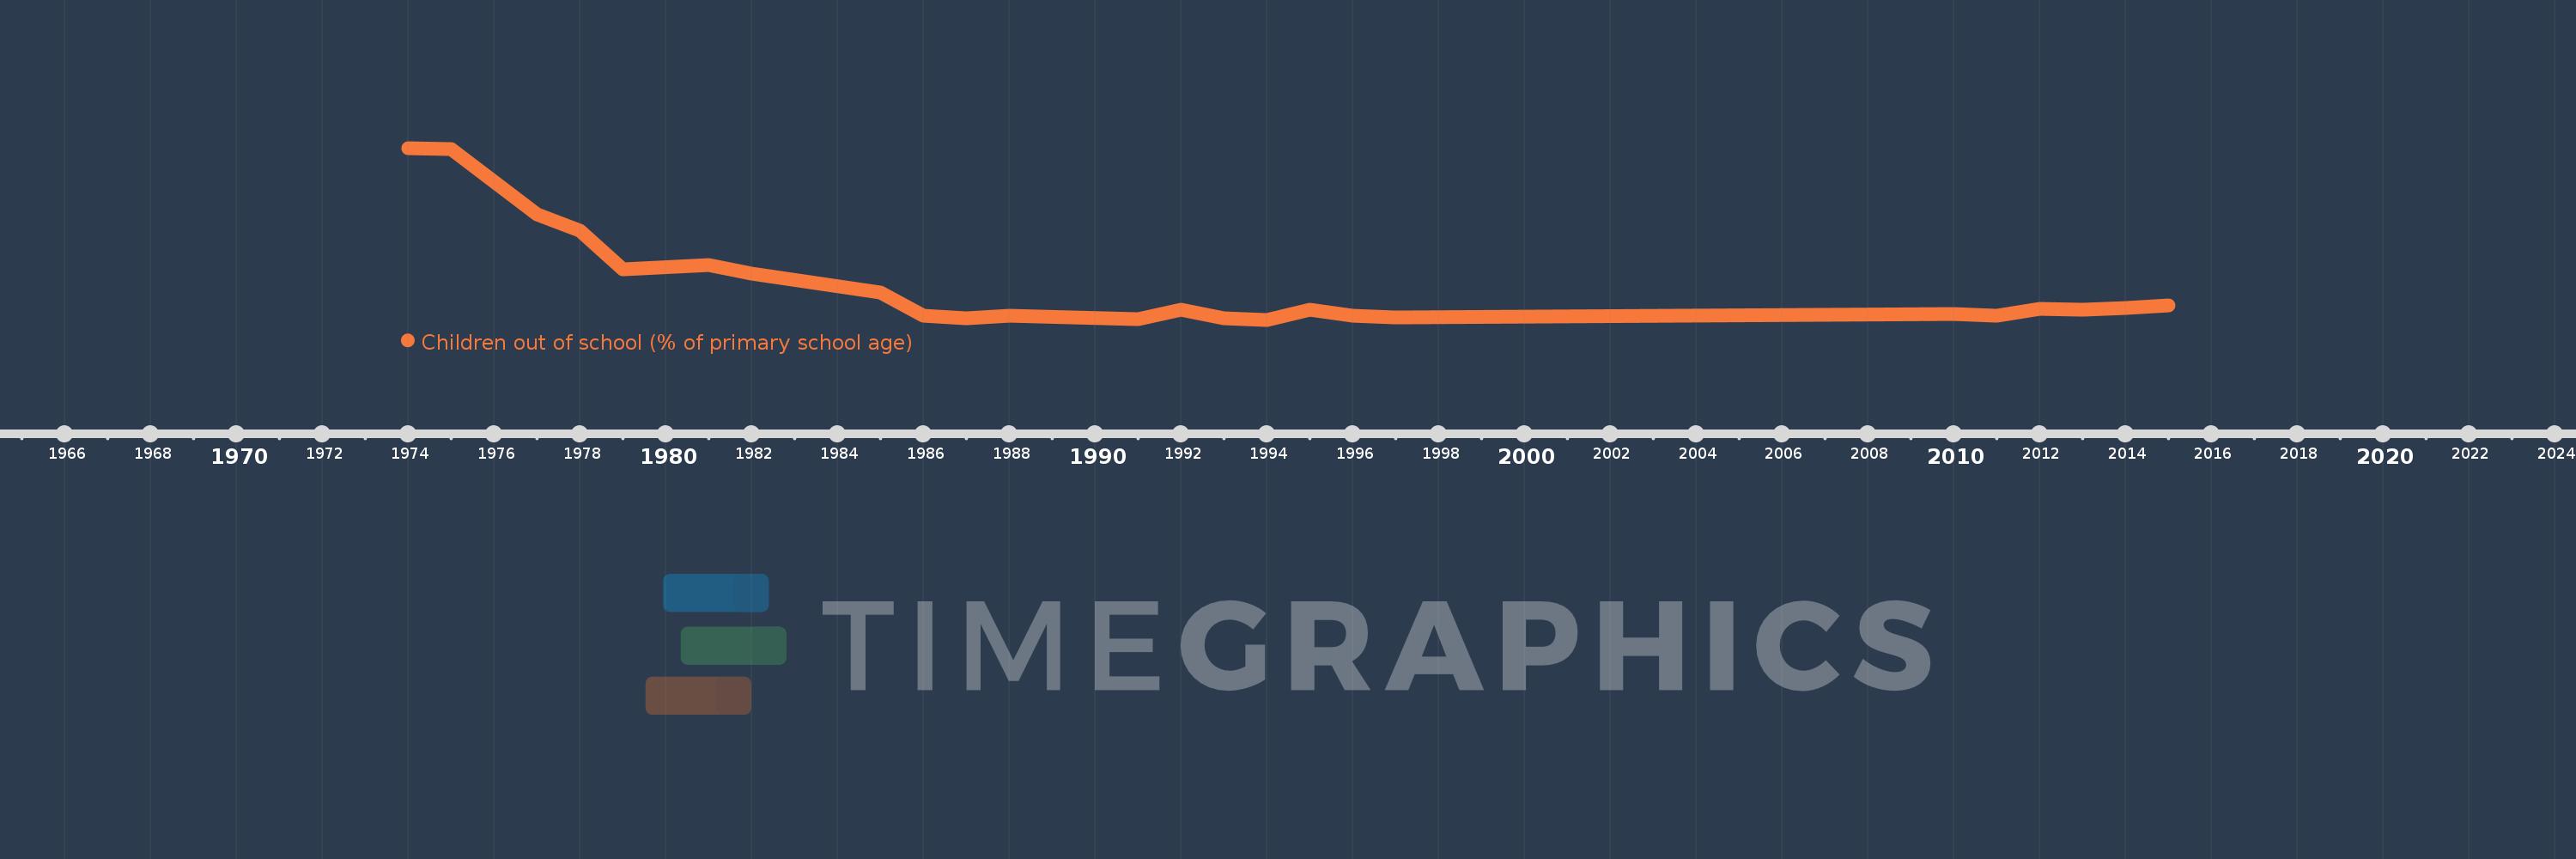
Children out of school (% of primary school age)
2015,2014,2013,2012,2011,2010,1997,1996,1995,1994,1993,1992,1991,1988,1987,1986,1985,1982,1981,1979,1978,1977,1975,1974