33
/pt/
AIzaSyB4mHJ5NPEv-XzF7P6NDYXjlkCWaeKw5bc
November 1, 2025
222931
Peru
PER
true
2
1
Share of youth not in education, employment, or training, male (% of male youth population)
2014,2013,2012,2011,2010,2008
Create a timeline
Public Timelines
For education
For educational institutions
For teachers
For students
Cabinet
For educational institutions
For teachers
For students
Open cabinet
FAQ
Receber premium
Close
Create a timeline
Public timelines
FAQ
About & Feedback
Acordo
Privacidade
FAQ
Support 24/7
Cabinet
Get premium
Donate
Download
Biblioteca de estatísticas globais
→
Peru
→
Share of youth not in education, employment, or training, male (% of male youth population)
Estas estatísticas em outros países:
Albania
Algeria
Argentina
Armenia
Aruba
Australia
Austria
Azerbaijan
Bangladesh
Belarus
Belgium
Belize
Benin
Bermuda
Bolivia
Brazil
Bulgaria
Cambodia
Cameroon
Canada
Central Europe and the Baltics
Chile
Colombia
Costa Rica
Croatia
Cyprus
Czech Republic
Denmark
Dominican Republic
Early-demographic dividend
Ecuador
Egypt, Arab Rep.
El Salvador
Estonia
Ethiopia
Euro area
Europe & Central Asia
Europe & Central Asia (excluding high income)
Europe & Central Asia (IDA & IBRD countries)
European Union
Finland
France
Germany
Greece
Guatemala
High income
Honduras
Hong Kong SAR, China
Hungary
Iceland
India
Indonesia
Iran, Islamic Rep.
Ireland
Israel
Italy
Jamaica
Japan
Jordan
Korea, Rep.
Kyrgyz Republic
Latin America & Caribbean
Latin America & Caribbean (excluding high income)
Latin America & the Caribbean (IDA & IBRD countries)
Latvia
Liberia
Lithuania
Luxembourg
Macao SAR, China
Macedonia, FYR
Madagascar
Malawi
Malaysia
Maldives
Mali
Malta
Mexico
Moldova
Mongolia
Mozambique
Nepal
Netherlands
New Zealand
Nicaragua
North America
Norway
OECD members
Panama
Paraguay
Peru
Philippines
Poland
Portugal
Post-demographic dividend
Qatar
Romania
Russian Federation
Rwanda
Samoa
Saudi Arabia
Serbia
Singapore
Slovak Republic
Slovenia
South Africa
South Asia
South Asia (IDA & IBRD)
South Sudan
Spain
Sri Lanka
Sudan
Sweden
Switzerland
Tajikistan
Tanzania
Thailand
Togo
Trinidad and Tobago
Tunisia
Turkey
Uganda
Ukraine
United Kingdom
United States
Uruguay
Venezuela, RB
Vietnam
West Bank and Gaza
Yemen, Rep.
Zambia
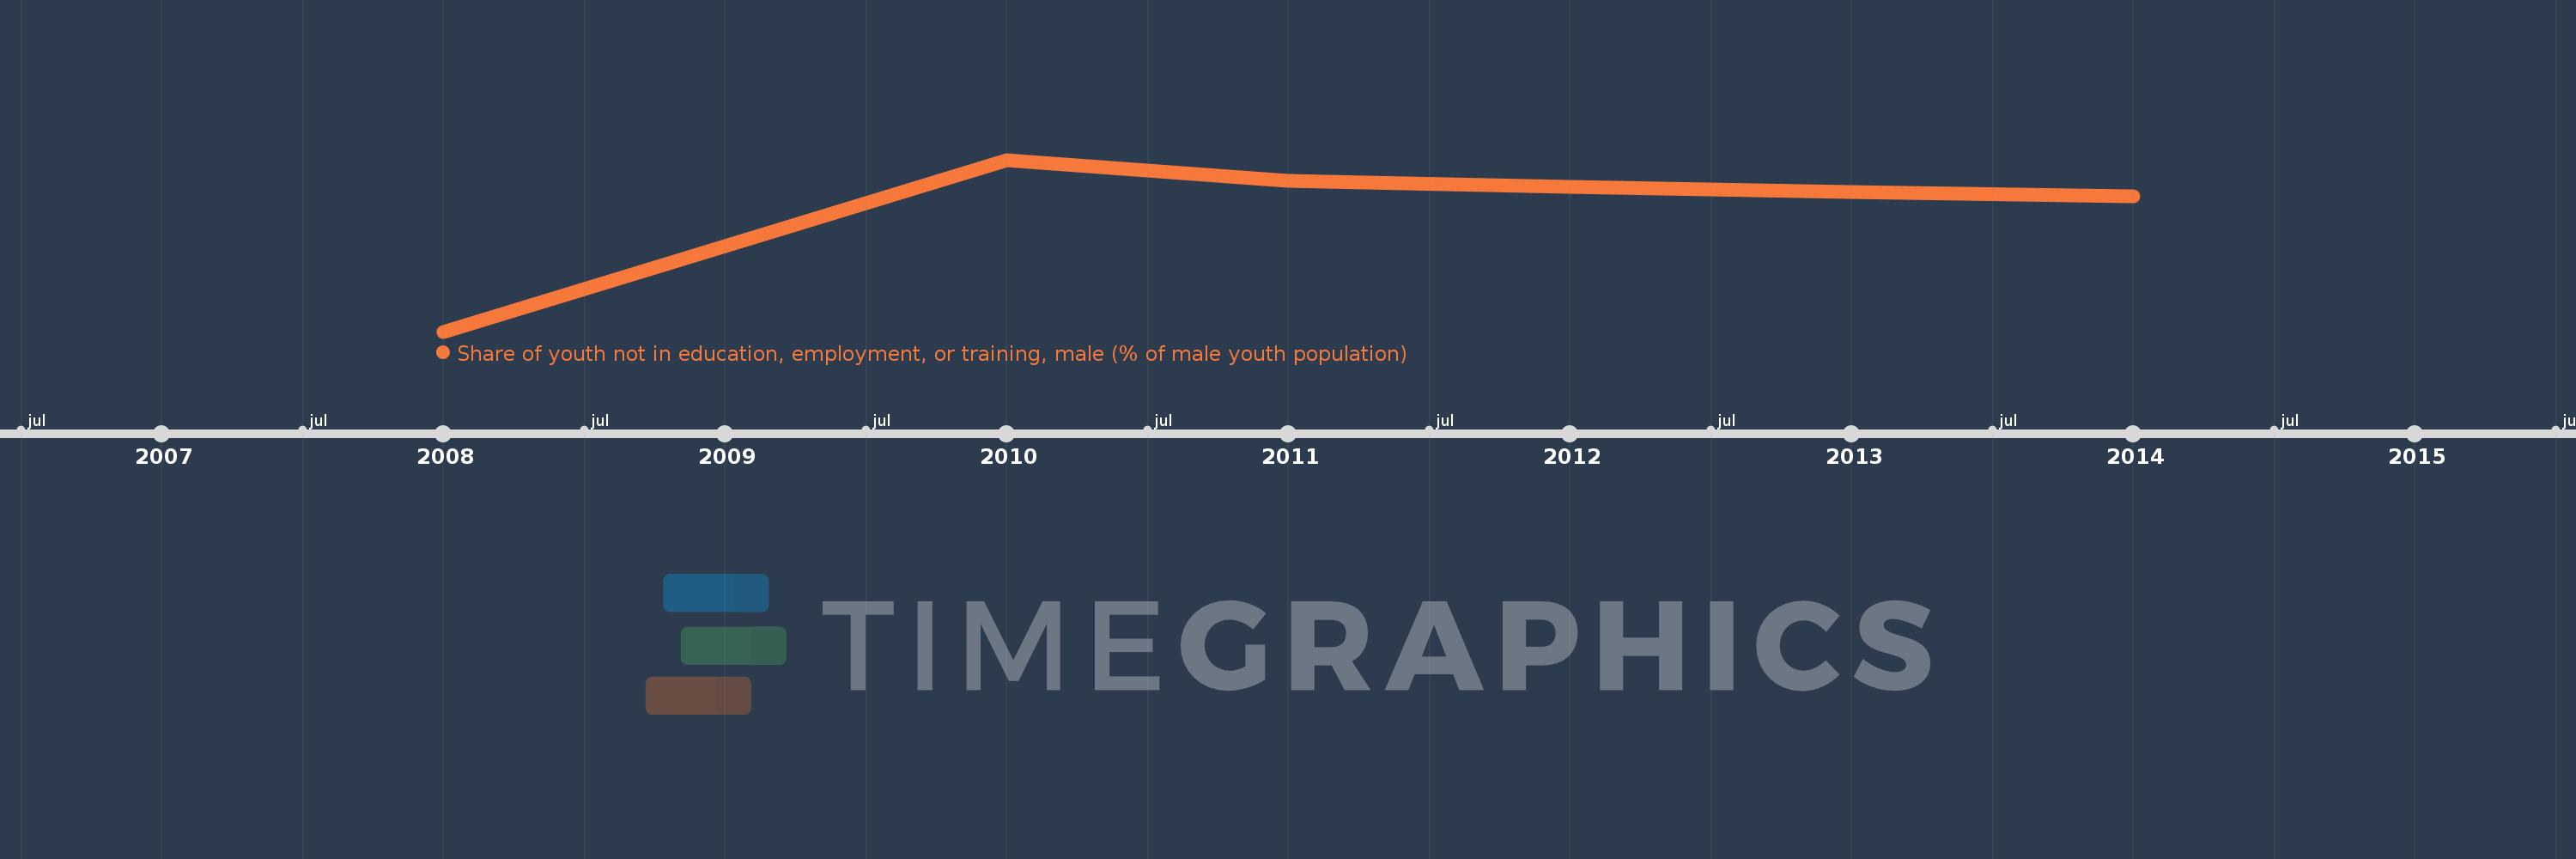
Linha do tempo:
Nesta escala de tempo está apresentado um gráfico de
2008
ano até
2014
ano Peru. Dados de
2007
ano ausente. O número de observações reais por data:
6
.
Fonte (nome):
Indicadores de desenvolvimento mundial
Fonte (organização):
International Labour Organization, Key Indicators of the Labour Market database.
Categorias:
Social Protection & Labor
Foi atualizado:
23 abr 2017 ano
Indicadores de alterações dos valores ao longo dos anos
Em média:
11.058
Mínimo:
6.47
1 jan 2008 ano
Máximo:
12.84
1 jan 2010 ano
Na data de observação
Valor
Mudança absoluta
A alteração em relação ao valor anterior
1 jan 2008 ano
6.47
+6.47
0.0%
1 jan 2010 ano
12.84
+6.37
98.45%
1 jan 2011 ano
12.07
-0.77
-6.0%
1 jan 2012 ano
11.85
-0.22
-1.82%
1 jan 2013 ano
11.63
-0.22
-1.86%
1 jan 2014 ano
11.49
-0.14
-1.2%
Classificação de países por estatísticas atuais por anos
About & Feedback
Acordo
Privacidade
FAQ
Support 24/7
Cabinet
Get premium
Donate
The service accepts bank transfer (ACH, Wire) or cards (Visa, MasterCard, etc). Processed by Stripe.
Secured with SSL