33
/pt/
AIzaSyAYiBZKx7MnpbEhh9jyipgxe19OcubqV5w
August 1, 2025
221041
Paraguay
PRY
true
2
1
Labor force participation rate for ages 15-24, total (%) (national estimate)
2015,2014,2009,2008,2003,2002,2000,1999,1997,1996,1995,1994,1993,1992,1991,1990,1983,1981
Download
Biblioteca de estatísticas globais →Paraguay →

Labor force participation rate for ages 15-24, total (%) (national estimate)

Estas estatísticas em outros países:

AlbaniaAlgeriaAmerican SamoaAntigua and BarbudaArgentinaArmeniaArubaAustraliaAustriaAzerbaijanBahamas, TheBahrainBangladeshBarbadosBelarusBelgiumBelizeBeninBermudaBhutanBoliviaBosnia and HerzegovinaBotswanaBrazilBritish Virgin IslandsBrunei DarussalamBulgariaBurkina FasoBurundiCabo VerdeCambodiaCameroonCanadaCaribbean small statesCayman IslandsCentral African RepublicCentral Europe and the BalticsChadChileColombiaComorosCongo, Dem. Rep.Congo, Rep.Costa RicaCote d'IvoireCroatiaCubaCyprusCzech RepublicDenmarkDjiboutiDominicaDominican RepublicEarly-demographic dividendEcuadorEgypt, Arab Rep.El SalvadorEquatorial GuineaEstoniaEthiopiaEuro areaEurope & Central AsiaEurope & Central Asia (excluding high income)Europe & Central Asia (IDA & IBRD countries)European UnionFijiFinlandFranceFrench PolynesiaGabonGambia, TheGeorgiaGermanyGhanaGibraltarGreeceGrenadaGuamGuatemalaGuineaGuyanaHaitiHigh incomeHondurasHong Kong SAR, ChinaHungaryIcelandIDA blendIndiaIndonesiaIran, Islamic Rep.IraqIrelandIsle of ManIsraelItalyJamaicaJapanJordanKazakhstanKenyaKiribatiKorea, Rep.KosovoKuwaitKyrgyz RepublicLao PDRLatin America & Caribbean Latin America & Caribbean (excluding high income)Latin America & the Caribbean (IDA & IBRD countries)LatviaLebanonLesothoLiberiaLibyaLiechtensteinLithuaniaLower middle incomeLuxembourgMacao SAR, ChinaMacedonia, FYRMadagascarMalawiMalaysiaMaldivesMaliMaltaMauritiusMexicoMiddle East & North AfricaMiddle East & North Africa (excluding high income)Middle East & North Africa (IDA & IBRD countries)MoldovaMonacoMongoliaMontenegroMoroccoMozambiqueMyanmarNamibiaNauruNepalNetherlandsNew ZealandNicaraguaNigerNigeriaNorth AmericaNorthern Mariana IslandsNorwayOECD membersOmanPakistanPalauPanamaPapua New GuineaParaguayPeruPhilippinesPolandPortugalPost-demographic dividendPuerto RicoQatarRomaniaRussian FederationRwandaSamoaSan MarinoSao Tome and PrincipeSaudi ArabiaSenegalSerbiaSeychellesSierra LeoneSingaporeSlovak RepublicSloveniaSolomon IslandsSouth AfricaSouth AsiaSouth Asia (IDA & IBRD)South SudanSpainSri LankaSt. Kitts and NevisSt. LuciaSt. Vincent and the GrenadinesSudanSurinameSwazilandSwedenSwitzerlandSyrian Arab RepublicTajikistanTanzaniaThailandTimor-LesteTogoTongaTrinidad and TobagoTunisiaTurkeyTurks and Caicos IslandsUgandaUkraineUnited Arab EmiratesUnited KingdomUnited StatesUruguayVanuatuVenezuela, RBVietnamVirgin Islands (U.S.)West Bank and GazaYemen, Rep.ZambiaZimbabwe

Linha do tempo:

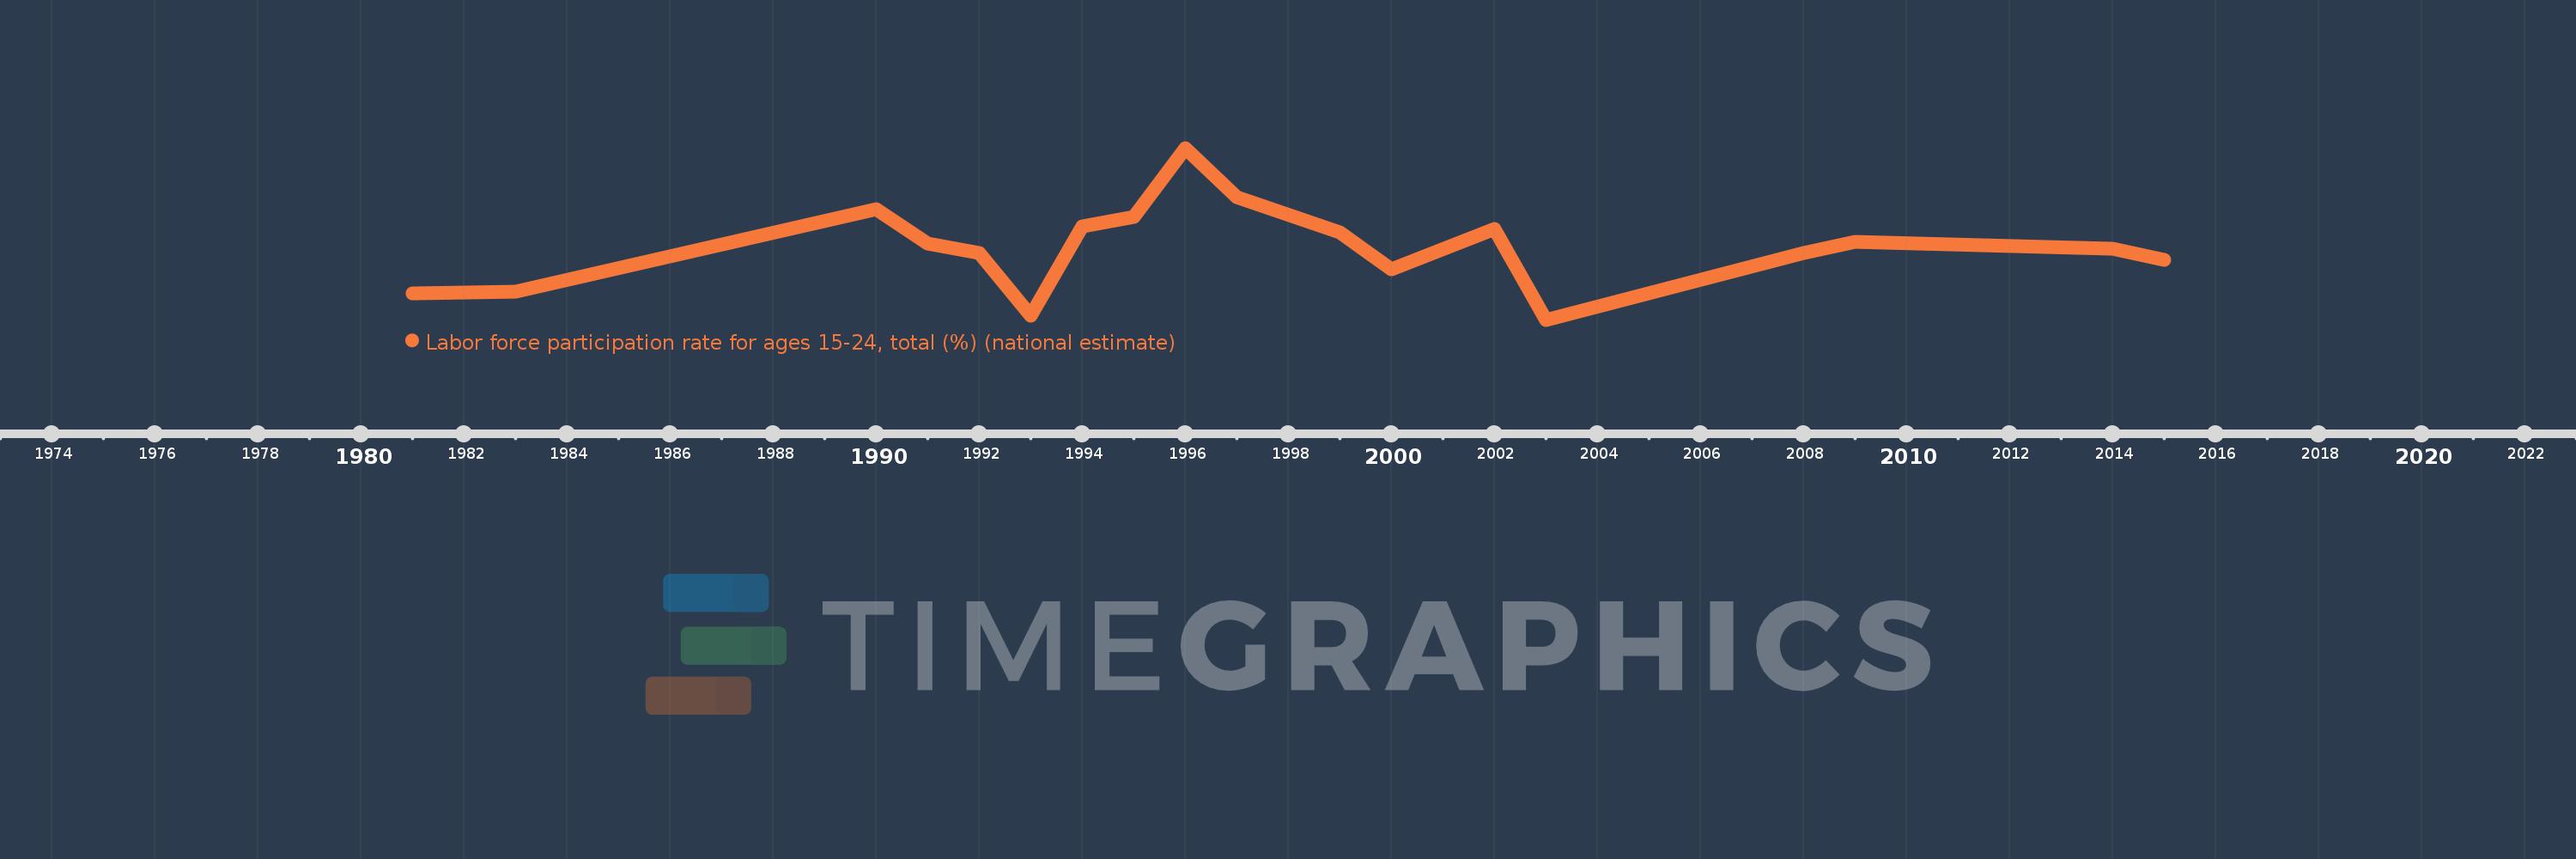
Nesta escala de tempo está apresentado um gráfico de 1981 ano até 2015 ano Paraguay. Dados de 1980 ano ausente. O número de observações reais por data: 18.

Fonte (nome):

Indicadores de desenvolvimento mundial

Fonte (organização):

International Labour Organization, Key Indicators of the Labour Market database.

Categorias:

Social Protection & Labor

Foi atualizado:

23 abr 2017 ano

Indicadores de alterações dos valores ao longo dos anos

Em média:
58.811
Mínimo:
49.5
1 jan 2003 ano
Máximo:
71.5
1 jan 1996 ano
Na data de observação
Valor
Mudança absoluta
A alteração em relação ao valor anterior
1 jan 1981 ano
52.9
+52.9
0.0%
1 jan 1983 ano
53.1
+0.2
0.38%
1 jan 1990 ano
63.7
+10.6
19.96%
1 jan 1991 ano
59.3
-4.4
-6.91%
1 jan 1992 ano
58.0
-1.3
-2.19%
1 jan 1993 ano
50.0
-8.0
-13.79%
1 jan 1994 ano
61.5
+11.5
23.0%
1 jan 1995 ano
62.7
+1.2
1.95%
1 jan 1996 ano
71.5
+8.8
14.04%
1 jan 1997 ano
65.2
-6.3
-8.81%
1 jan 1999 ano
60.7
-4.5
-6.9%
1 jan 2000 ano
56.0
-4.7
-7.74%
1 jan 2002 ano
61.1
+5.1
9.11%
1 jan 2003 ano
49.5
-11.6
-18.99%
1 jan 2008 ano
58.1
+8.6
17.37%
1 jan 2009 ano
59.5
+1.4
2.41%
1 jan 2014 ano
58.6
-0.9
-1.51%
1 jan 2015 ano
57.2
-1.4
-2.39%

Classificação de países por estatísticas atuais por anos