33
/pt/
AIzaSyB4mHJ5NPEv-XzF7P6NDYXjlkCWaeKw5bc
November 30, 2025
220178
Papua New Guinea
PNG
true
2
1
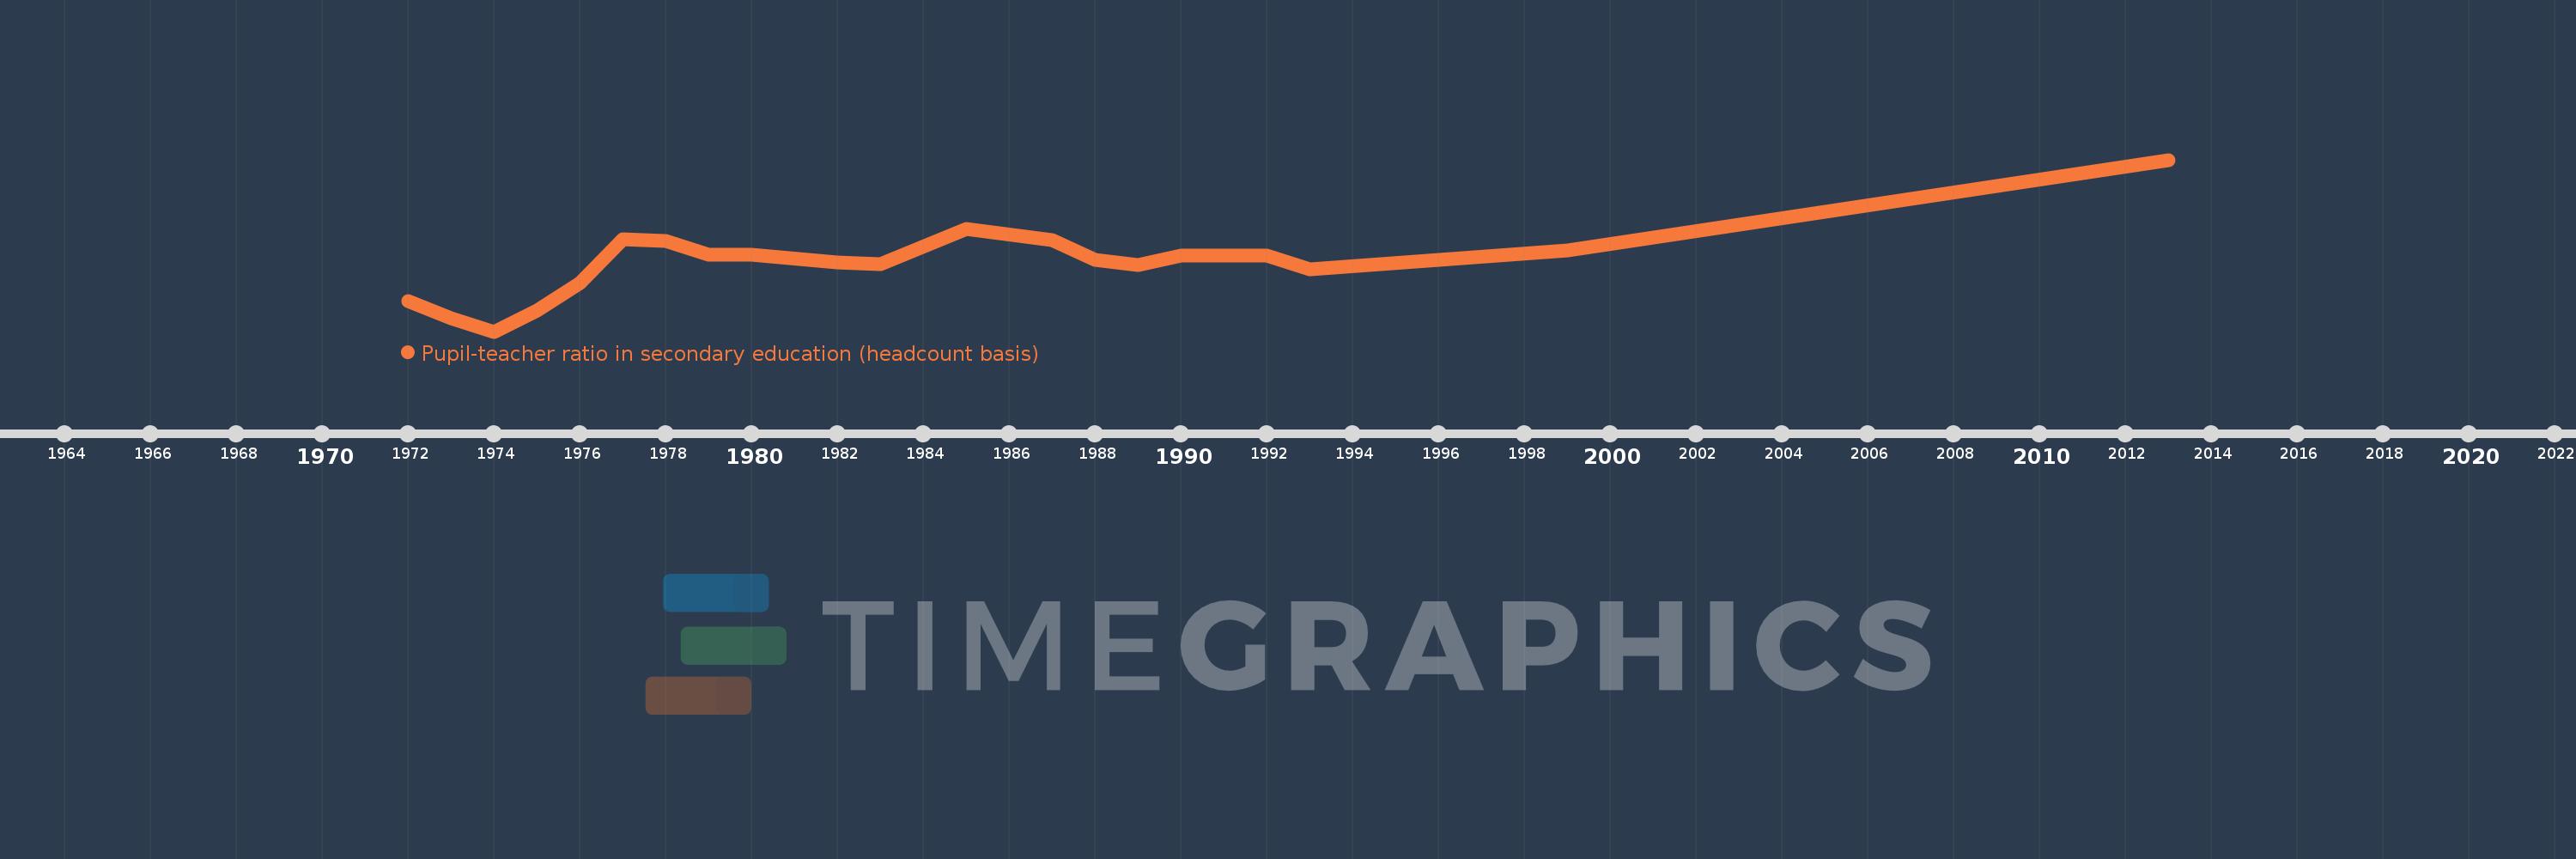
Pupil-teacher ratio in secondary education (headcount basis)
2013,1999,1993,1992,1990,1989,1988,1987,1985,1983,1982,1980,1979,1978,1977,1976,1975,1974,1973,1972