29
/pt/
pt
AIzaSyAYiBZKx7MnpbEhh9jyipgxe19OcubqV5w
April 1, 2024
219196
Panama
PAN
true
2
1
Unemployment with secondary education, male (% of male unemployment)
2013,2012,2011,2010,2009,2008,2007,2006,2005,2004,2003,2002,1995,1994,1993,1990,1989,1988,1987,1986
Download
Biblioteca de estatísticas globais →Panama →

Unemployment with secondary education, male (% of male unemployment)

Estas estatísticas em outros países:
AlbaniaAlgeriaArgentinaArmeniaArubaAustraliaAustriaAzerbaijanBahamas, TheBahrainBangladeshBarbadosBelarusBelgiumBelizeBermudaBhutanBoliviaBosnia and HerzegovinaBotswanaBrazilBritish Virgin IslandsBrunei DarussalamBulgariaBurkina FasoCanadaCaribbean small statesCayman IslandsCentral African RepublicCentral Europe and the BalticsChileColombiaCosta RicaCroatiaCubaCyprusCzech RepublicDenmarkDominicaDominican RepublicEarly-demographic dividendEcuadorEgypt, Arab Rep.El SalvadorEstoniaEthiopiaEuro areaEurope & Central AsiaEurope & Central Asia (excluding high income)Europe & Central Asia (IDA & IBRD countries)European UnionFijiFinlandFranceGabonGeorgiaGermanyGreeceGuatemalaHigh incomeHondurasHong Kong SAR, ChinaHungaryIcelandIndiaIndonesiaIran, Islamic Rep.IrelandIsraelItalyJamaicaJapanJordanKazakhstanKorea, Rep.KosovoKuwaitKyrgyz RepublicLatin America & Caribbean Latin America & Caribbean (excluding high income)Latin America & the Caribbean (IDA & IBRD countries)LatviaLebanonLesothoLithuaniaLower middle incomeLuxembourgMacao SAR, ChinaMacedonia, FYRMadagascarMalaysiaMaltaMauritiusMexicoMiddle East & North AfricaMiddle East & North Africa (excluding high income)Middle East & North Africa (IDA & IBRD countries)MoldovaMongoliaMontenegroMoroccoNamibiaNetherlandsNew CaledoniaNew ZealandNicaraguaNorth AmericaNorwayOECD membersOmanPakistanPanamaParaguayPeruPhilippinesPolandPortugalPost-demographic dividendQatarRomaniaRussian FederationRwandaSan MarinoSaudi ArabiaSenegalSerbiaSingaporeSlovak RepublicSloveniaSouth AfricaSouth AsiaSouth Asia (IDA & IBRD)SpainSri LankaSt. LuciaSt. Vincent and the GrenadinesSurinameSwedenSwitzerlandSyrian Arab RepublicTajikistanTanzaniaThailandTimor-LesteTongaTrinidad and TobagoTunisiaTurkeyUkraineUnited Arab EmiratesUnited KingdomUnited StatesUruguayVenezuela, RBWest Bank and GazaZimbabwe
Linha do tempo:
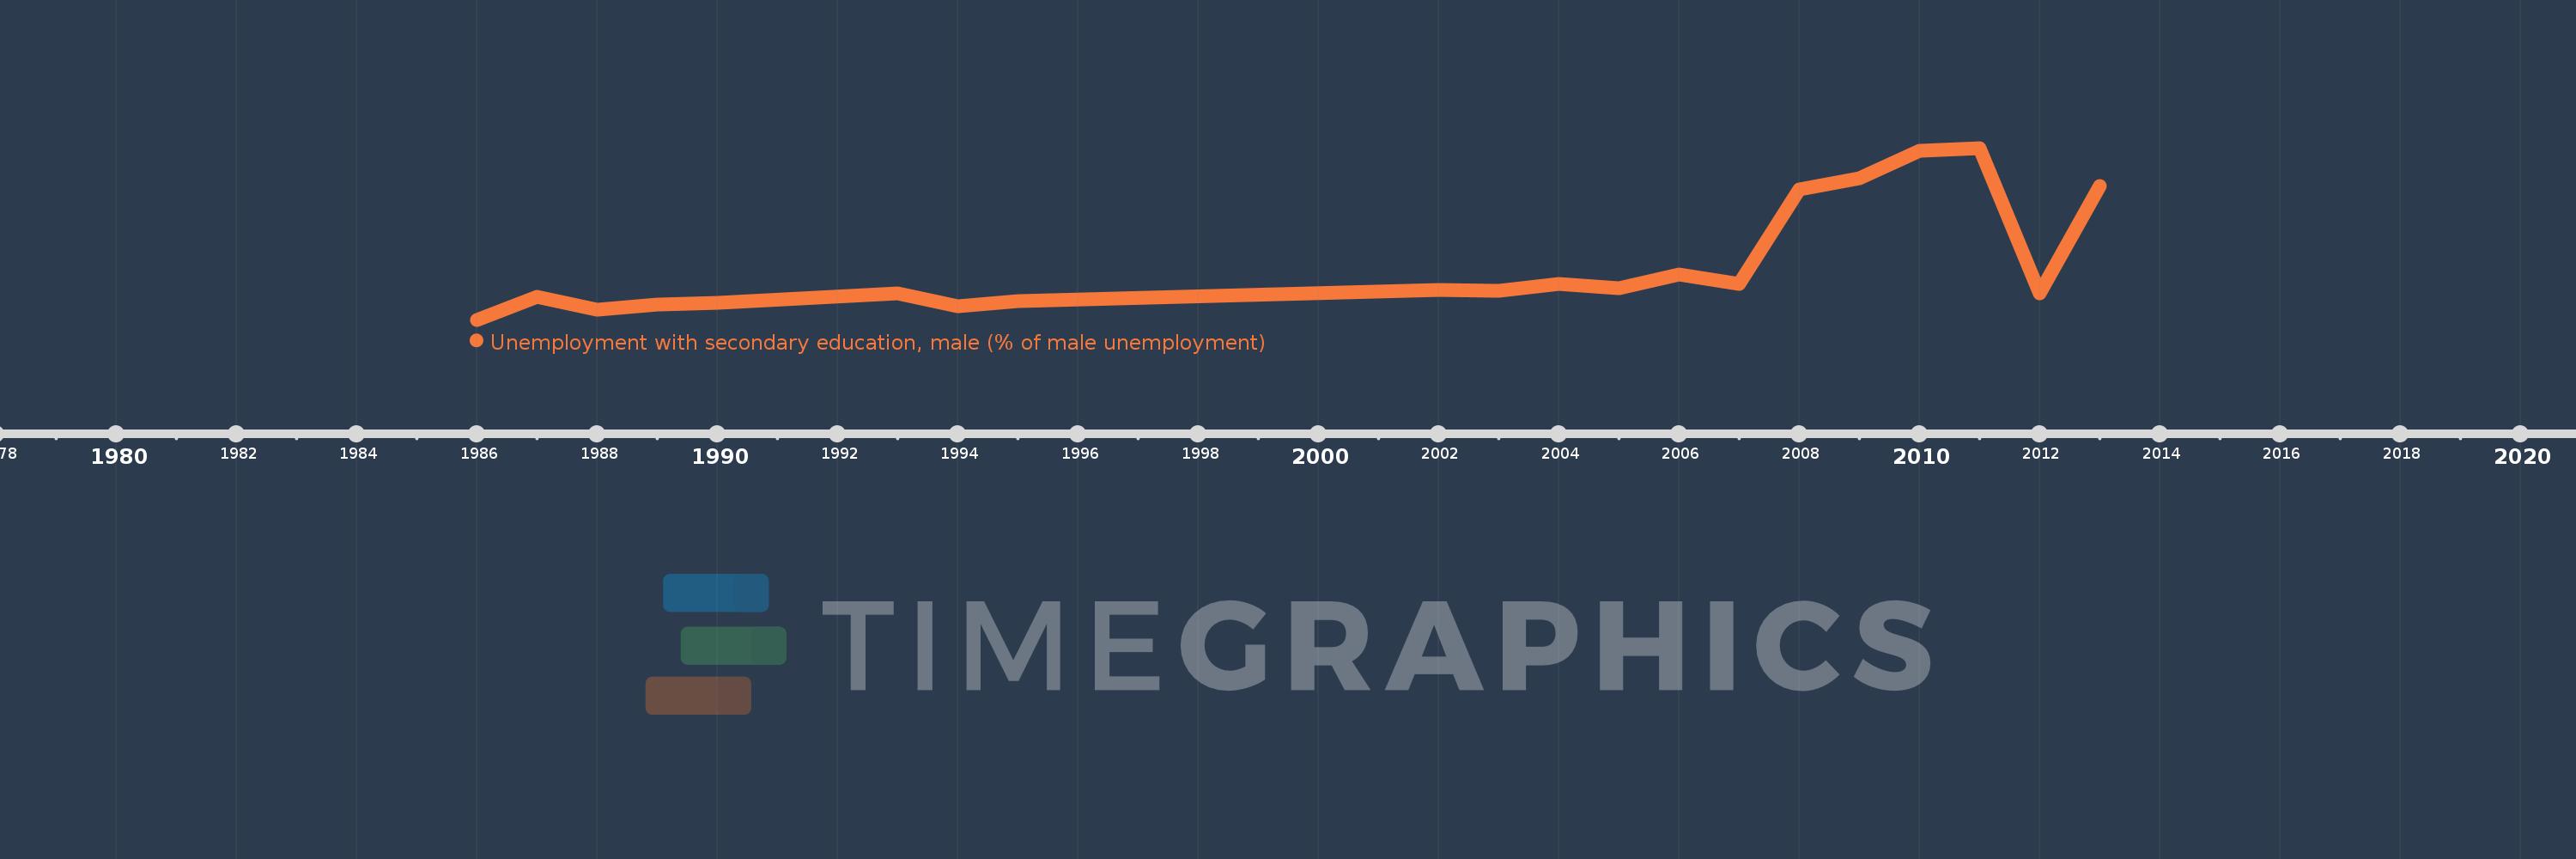
Nesta escala de tempo está apresentado um gráfico de 1986 ano até 2013 ano Panama. Dados de 1985 ano ausente. O número de observações reais por data: 20.
Fonte (nome):
Indicadores de desenvolvimento mundial
Fonte (organização):
International Labour Organization, Key Indicators of the Labour Market database.
Categorias:
Social Protection & Labor, Gender
Foi atualizado:
23 abr 2017 ano
Indicadores de alterações dos valores ao longo dos anos
Em média:
40.435
Mínimo:
24.3
1 jan 1986 ano
Máximo:
74.5
1 jan 2011 ano
Na data de observação
Valor
Mudança absoluta
A alteração em relação ao valor anterior
1 jan 1986 ano
24.3
+24.3
0.0%
1 jan 1987 ano
31.1
+6.8
27.98%
1 jan 1988 ano
27.2
-3.9
-12.54%
1 jan 1989 ano
28.7
+1.5
5.51%
1 jan 1990 ano
29.3
+0.6
2.09%
1 jan 1993 ano
32.0
+2.7
9.22%
1 jan 1994 ano
28.3
-3.7
-11.56%
1 jan 1995 ano
29.8
+1.5
5.3%
1 jan 2002 ano
33.0
+3.2
10.74%
1 jan 2003 ano
32.7
-0.3
-0.91%
1 jan 2004 ano
34.7
+2.0
6.12%
1 jan 2005 ano
33.4
-1.3
-3.75%
1 jan 2006 ano
37.5
+4.1
12.28%
1 jan 2007 ano
34.8
-2.7
-7.2%
1 jan 2008 ano
62.5
+27.7
79.6%
1 jan 2009 ano
65.7
+3.2
5.12%
1 jan 2010 ano
73.7
+8.0
12.18%
1 jan 2011 ano
74.5
+0.8
1.09%
1 jan 2012 ano
32.1
-42.4
-56.91%
1 jan 2013 ano
63.4
+31.3
97.51%
Classificação de países por estatísticas atuais por anos

Comentários:

Enviar
PremiumAbout & FeedbackAcordoPrivacidade
logo
© 2022 Selected Technologies LLC – Morgan Hill, California