33
/pt/
AIzaSyB4mHJ5NPEv-XzF7P6NDYXjlkCWaeKw5bc
November 1, 2025
213651
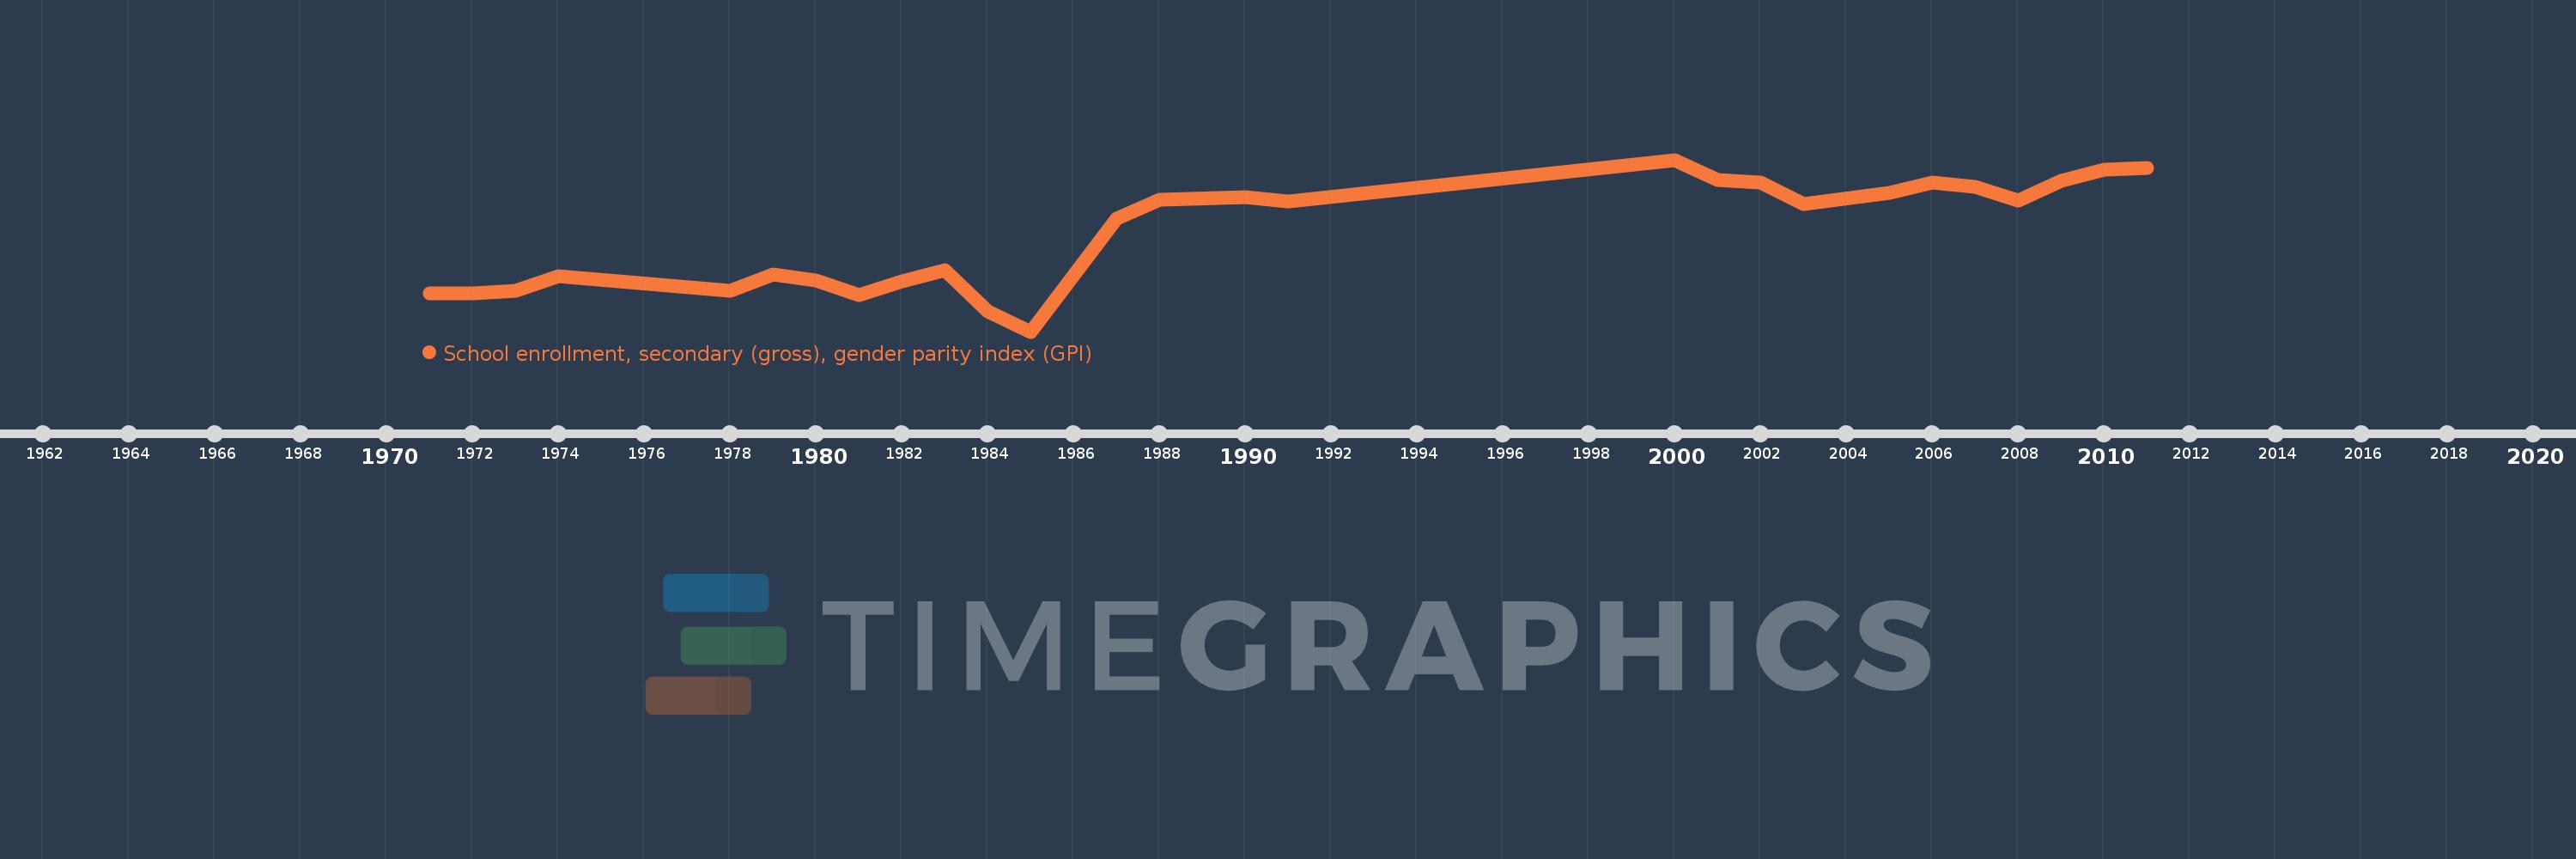
Nigeria
NGA
true
2
1
School enrollment, secondary (gross), gender parity index (GPI)
2011,2010,2009,2008,2007,2006,2005,2003,2002,2001,2000,1991,1990,1988,1987,1985,1984,1983,1982,1981,1980,1979,1978,1974,1973,1972,1971