30
/pt/
AIzaSyAYiBZKx7MnpbEhh9jyipgxe19OcubqV5w
April 1, 2024
211628
Niger
NER
true
2
1
Expenditure on secondary as % of government expenditure on education (%)
2015,2014,2013,2012,2011,2010,2009,2008,2007
Download
Biblioteca de estatísticas globais →Niger →

Expenditure on secondary as % of government expenditure on education (%)

Estas estatísticas em outros países:

AlbaniaAndorraAngolaAntigua and BarbudaArgentinaArmeniaArubaAustraliaAustriaBangladeshBarbadosBelgiumBelizeBeninBermudaBhutanBoliviaBotswanaBrazilBritish Virgin IslandsBrunei DarussalamBulgariaBurkina FasoBurundiCabo VerdeCambodiaCameroonCanadaCaribbean small statesCayman IslandsCentral African RepublicCentral Europe and the BalticsChadChileChinaColombiaComorosCongo, Dem. Rep.Congo, Rep.Costa RicaCote d'IvoireCubaCuracaoCyprusCzech RepublicDenmarkDjiboutiDominicaDominican RepublicEast Asia & PacificEast Asia & Pacific (IDA & IBRD countries)EcuadorEl SalvadorEquatorial GuineaEritreaEstoniaEthiopiaEuro areaEurope & Central AsiaEuropean UnionFijiFinlandFranceGabonGambia, TheGeorgiaGermanyGhanaGreeceGrenadaGuatemalaGuineaGuinea-BissauGuyanaHeavily indebted poor countries (HIPC)High incomeHondurasHong Kong SAR, ChinaHungaryIcelandIDA blendIDA onlyIDA totalIndiaIndonesiaIran, Islamic Rep.IrelandIsraelItalyJamaicaJapanJordanKenyaKorea, Rep.KuwaitKyrgyz RepublicLao PDRLate-demographic dividendLatin America & Caribbean Latin America & Caribbean (excluding high income)Latin America & the Caribbean (IDA & IBRD countries)LatviaLeast developed countries: UN classificationLebanonLesothoLiberiaLiechtensteinLithuaniaLow incomeMacao SAR, ChinaMadagascarMalawiMalaysiaMaldivesMaliMaltaMarshall IslandsMauritaniaMauritiusMexicoMoldovaMonacoMongoliaMoroccoMozambiqueNamibiaNepalNetherlandsNew ZealandNicaraguaNigerNorth AmericaNorwayOECD membersOmanOther small statesPakistanPalauPanamaParaguayPeruPhilippinesPolandPortugalPost-demographic dividendPre-demographic dividendPuerto RicoQatarRomaniaRwandaSamoaSan MarinoSao Tome and PrincipeSenegalSerbiaSeychellesSierra LeoneSingaporeSlovak RepublicSloveniaSmall statesSouth AfricaSouth AsiaSouth Asia (IDA & IBRD)South SudanSpainSri LankaSt. Kitts and NevisSt. LuciaSt. Vincent and the GrenadinesSub-Saharan Africa Sub-Saharan Africa (excluding high income)Sub-Saharan Africa (IDA & IBRD countries)SwazilandSwedenSwitzerlandSyrian Arab RepublicTanzaniaThailandTimor-LesteTogoTongaTrinidad and TobagoTunisiaTurks and Caicos IslandsUgandaUkraineUnited KingdomUnited StatesUruguayVanuatuVenezuela, RBVietnamWorldZambiaZimbabwe

Linha do tempo:

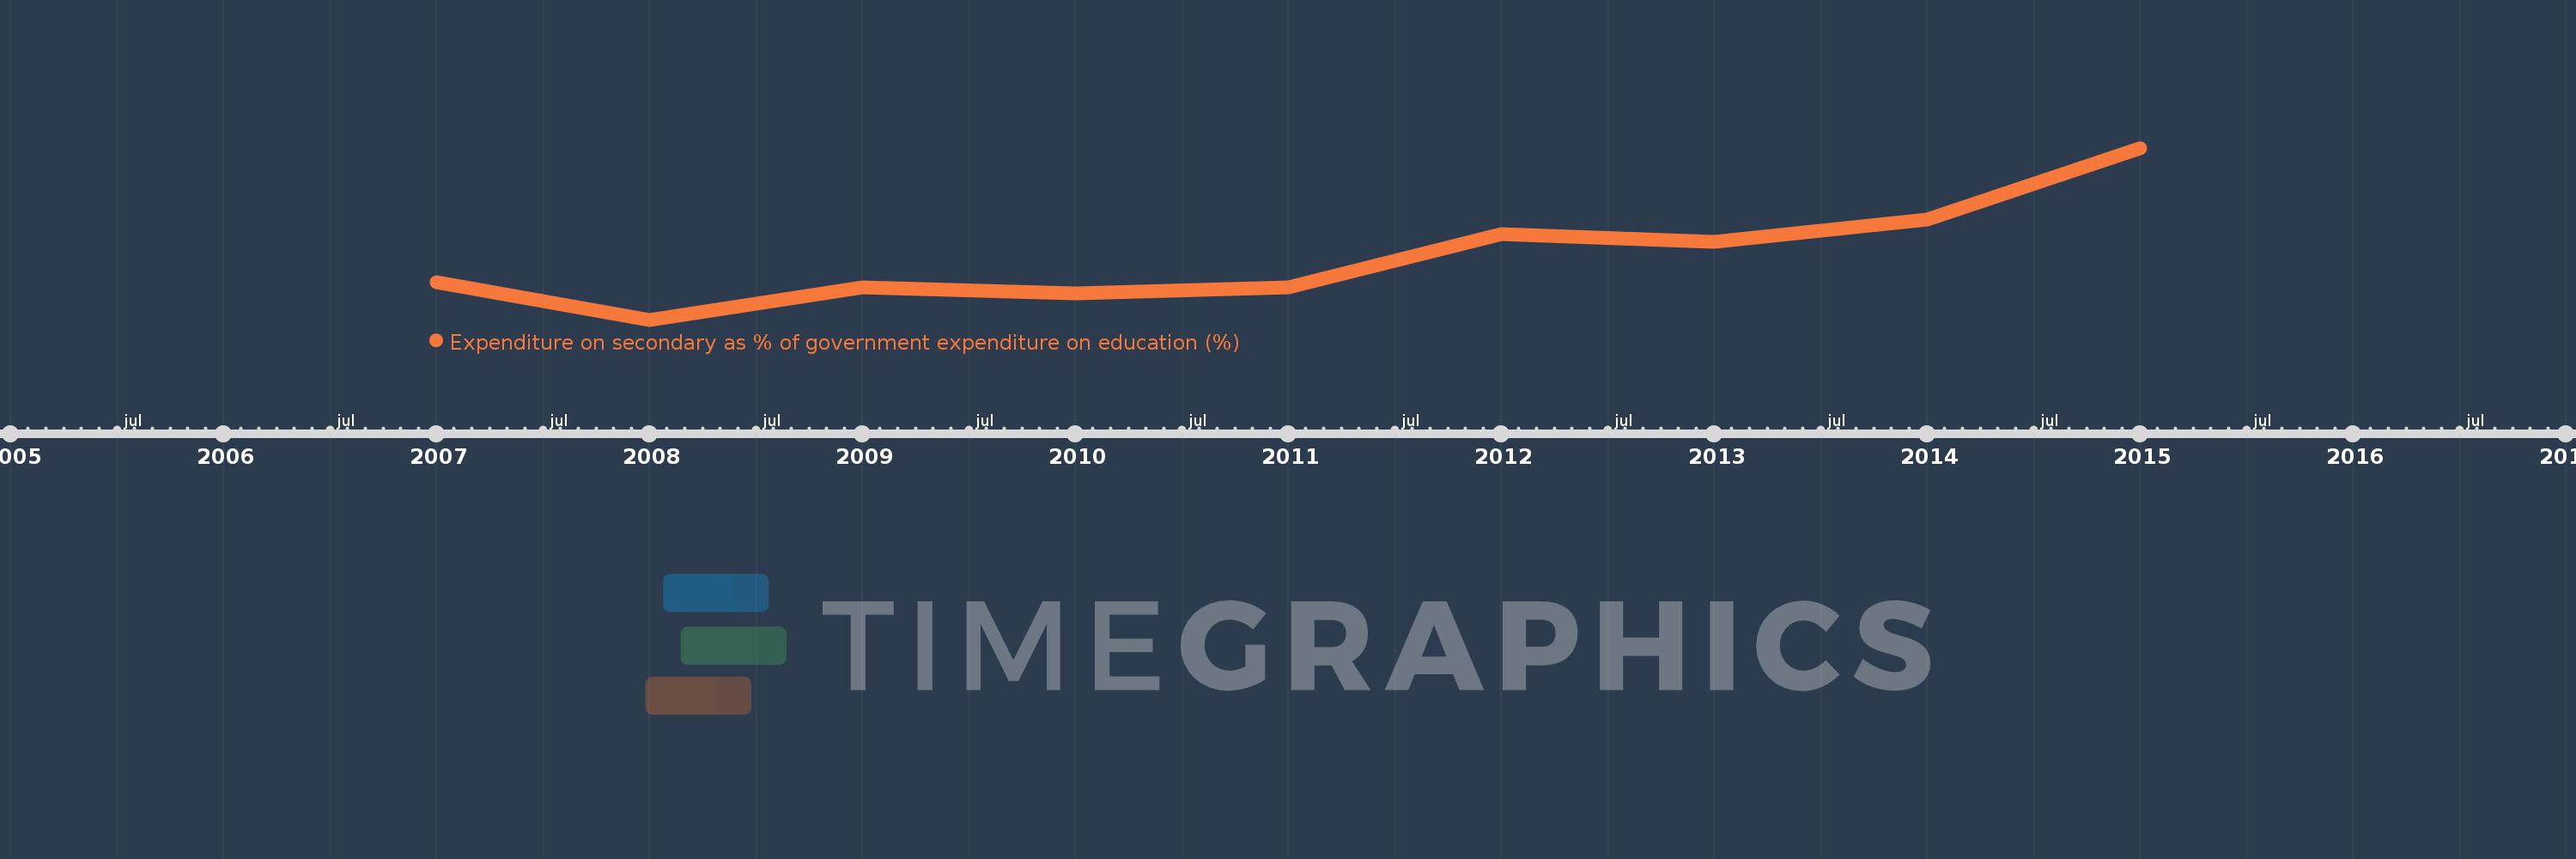
Nesta escala de tempo está apresentado um gráfico de 2007 ano até 2015 ano Niger. Dados de 2006 ano ausente. O número de observações reais por data: 9.

Fonte (nome):

Indicadores de desenvolvimento mundial

Fonte (organização):

UNESCO Institute for Statistics

Categorias:

Education

Foi atualizado:

23 abr 2017 ano

Indicadores de alterações dos valores ao longo dos anos

Em média:
22.973
Mínimo:
19.438
1 jan 2008 ano
Máximo:
29.12
1 jan 2015 ano
Na data de observação
Valor
Mudança absoluta
A alteração em relação ao valor anterior
1 jan 2007 ano
21.549
+21.549
0.0%
1 jan 2008 ano
19.438
-2.111
-9.8%
1 jan 2009 ano
21.247
+1.808
9.3%
1 jan 2010 ano
20.926
-0.32
-1.51%
1 jan 2011 ano
21.28
+0.354
1.69%
1 jan 2012 ano
24.278
+2.998
14.09%
1 jan 2013 ano
23.83
-0.448
-1.85%
1 jan 2014 ano
25.09
+1.261
5.29%
1 jan 2015 ano
29.12
+4.03
16.06%

Classificação de países por estatísticas atuais por anos