33
/pt/
AIzaSyAYiBZKx7MnpbEhh9jyipgxe19OcubqV5w
August 1, 2025
197254
Moldova
MDA
true
2
1
Children out of school, female (% of female primary school age)
2015,2014,2013,2012,2011,2010,2009,2008,2007,2006,2005,2004,2003,2002,2001
Download
Biblioteca de estatísticas globais →Moldova →

Children out of school, female (% of female primary school age)

Estas estatísticas em outros países:

AfghanistanAlbaniaAlgeriaAngolaAntigua and BarbudaArab WorldArgentinaArmeniaArubaAustraliaAustriaAzerbaijanBahamas, TheBahrainBangladeshBarbadosBelarusBelgiumBelizeBeninBermudaBhutanBoliviaBosnia and HerzegovinaBotswanaBrazilBrunei DarussalamBulgariaBurkina FasoBurundiCabo VerdeCambodiaCameroonCanadaCaribbean small statesCentral African RepublicCentral Europe and the BalticsChadChileChinaColombiaComorosCongo, Dem. Rep.Congo, Rep.Costa RicaCote d'IvoireCroatiaCubaCyprusDenmarkDjiboutiDominicaDominican RepublicEarly-demographic dividendEast Asia & PacificEast Asia & Pacific (excluding high income)East Asia & Pacific (IDA & IBRD countries)EcuadorEgypt, Arab Rep.El SalvadorEquatorial GuineaEritreaEstoniaEthiopiaEuro areaEurope & Central AsiaEurope & Central Asia (excluding high income)Europe & Central Asia (IDA & IBRD countries)European UnionFijiFinlandFragile and conflict affected situationsFranceGabonGambia, TheGeorgiaGhanaGreeceGrenadaGuatemalaGuineaGuinea-BissauGuyanaHaitiHeavily indebted poor countries (HIPC)High incomeHondurasHong Kong SAR, ChinaHungaryIBRD onlyIcelandIDA & IBRD totalIDA blendIDA onlyIDA totalIndiaIndonesiaIran, Islamic Rep.IraqIrelandIsraelItalyJamaicaJapanJordanKazakhstanKenyaKiribatiKorea, Dem. People’s Rep.Korea, Rep.KuwaitKyrgyz RepublicLao PDRLate-demographic dividendLatin America & Caribbean Latin America & Caribbean (excluding high income)Latin America & the Caribbean (IDA & IBRD countries)LatviaLeast developed countries: UN classificationLebanonLesothoLiberiaLibyaLiechtensteinLithuaniaLow & middle incomeLow incomeLower middle incomeLuxembourgMacao SAR, ChinaMacedonia, FYRMadagascarMalawiMaldivesMaliMaltaMarshall IslandsMauritaniaMauritiusMexicoMicronesia, Fed. Sts.Middle East & North AfricaMiddle East & North Africa (excluding high income)Middle East & North Africa (IDA & IBRD countries)Middle incomeMoldovaMongoliaMontenegroMoroccoMozambiqueMyanmarNamibiaNauruNepalNetherlandsNew ZealandNicaraguaNigerNigeriaNorth AmericaNorwayOECD membersOmanOther small statesPacific island small statesPakistanPanamaPapua New GuineaParaguayPeruPhilippinesPolandPortugalPost-demographic dividendPre-demographic dividendPuerto RicoQatarRomaniaRussian FederationRwandaSamoaSan MarinoSao Tome and PrincipeSaudi ArabiaSenegalSerbiaSeychellesSierra LeoneSloveniaSmall statesSolomon IslandsSomaliaSouth AfricaSouth AsiaSouth Asia (IDA & IBRD)South SudanSpainSri LankaSt. Kitts and NevisSt. LuciaSt. Vincent and the GrenadinesSub-Saharan Africa Sub-Saharan Africa (excluding high income)Sub-Saharan Africa (IDA & IBRD countries)SudanSurinameSwazilandSwedenSwitzerlandSyrian Arab RepublicTajikistanTanzaniaThailandTimor-LesteTogoTongaTrinidad and TobagoTunisiaTurkeyTuvaluUgandaUkraineUnited Arab EmiratesUnited KingdomUnited StatesUpper middle incomeUruguayUzbekistanVanuatuVenezuela, RBWest Bank and GazaWorldYemen, Rep.ZambiaZimbabwe

Linha do tempo:

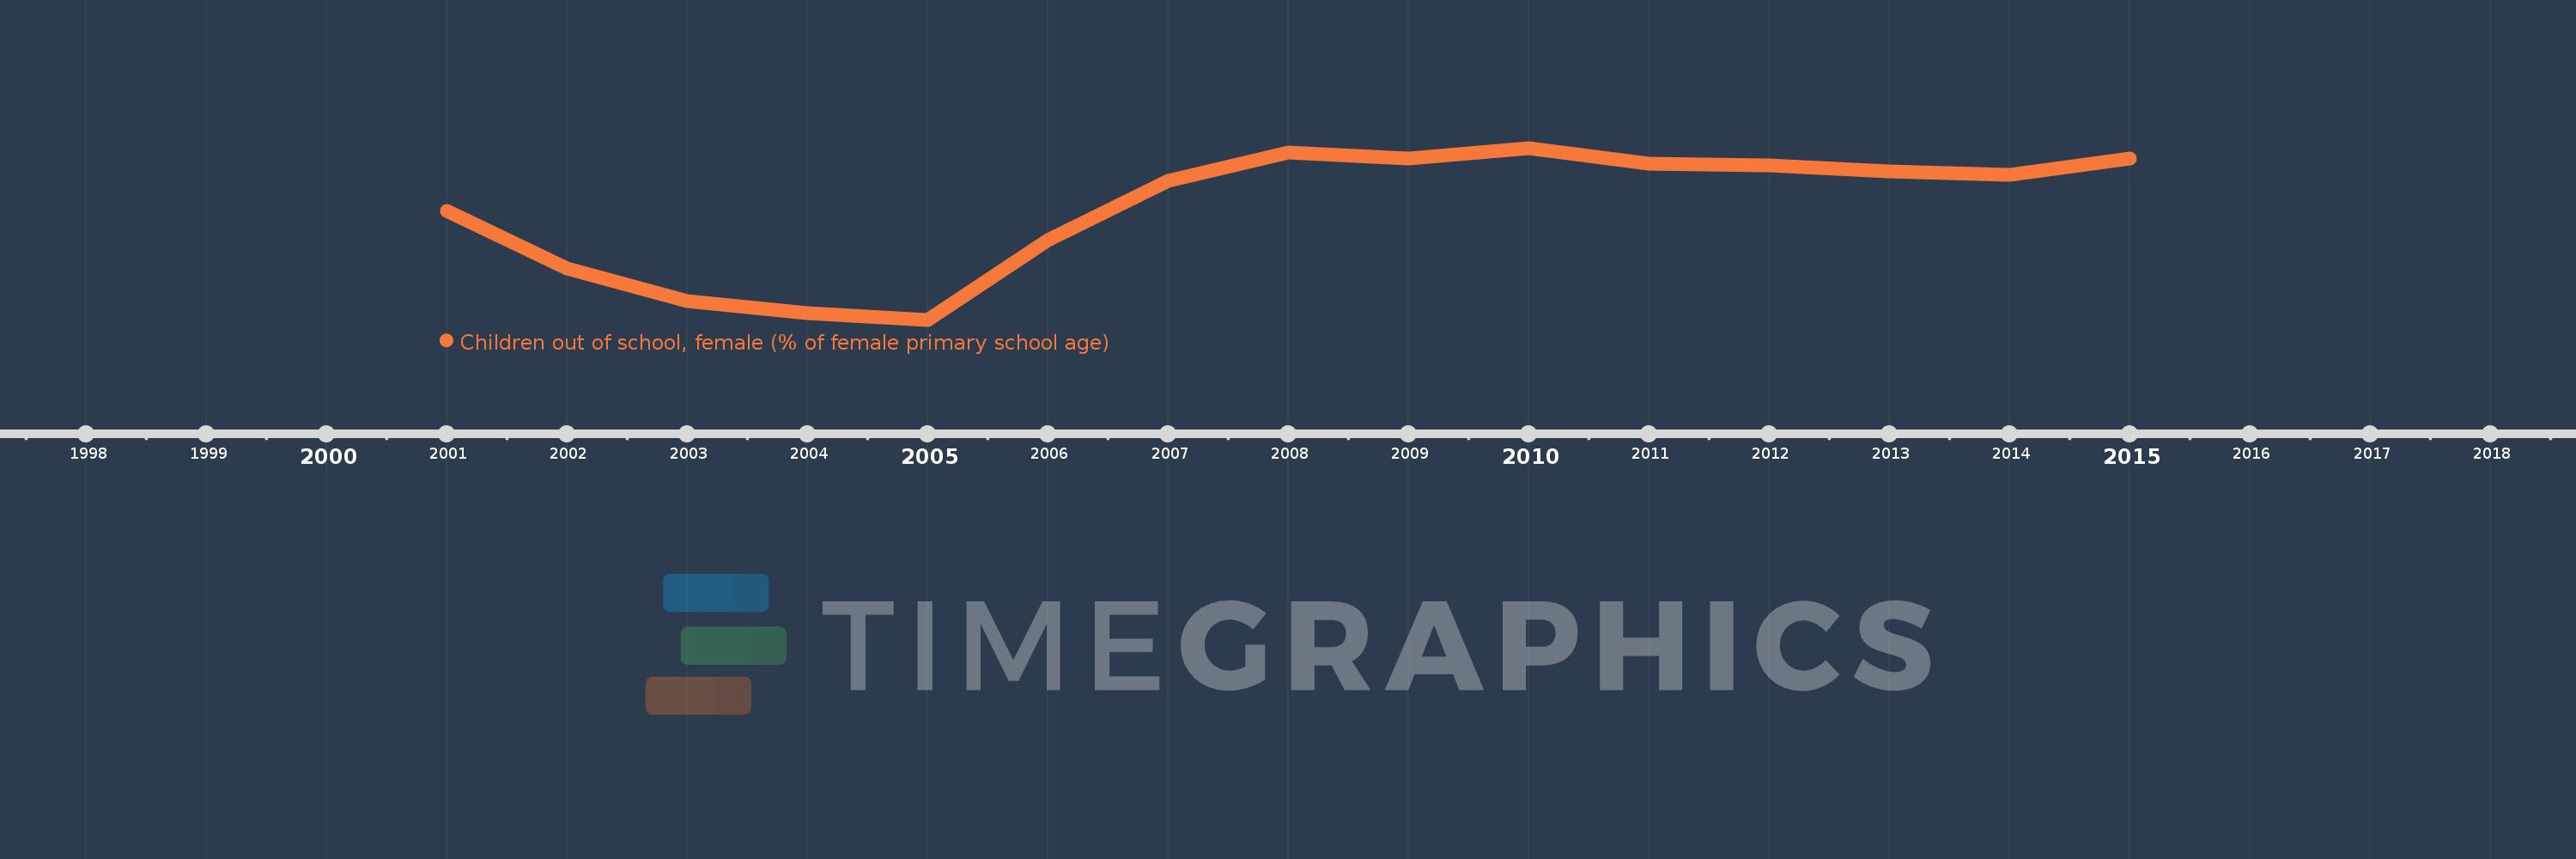
Nesta escala de tempo está apresentado um gráfico de 2001 ano até 2015 ano Moldova. Dados de 2000 ano ausente. O número de observações reais por data: 15.

Fonte (nome):

Indicadores de desenvolvimento mundial

Fonte (organização):

United Nations Educational, Scientific, and Cultural Organization (UNESCO) Institute for Statistics.

Categorias:

Education

Foi atualizado:

23 abr 2017 ano

Indicadores de alterações dos valores ao longo dos anos

Em média:
8.024
Mínimo:
3.492
1 jan 2005 ano
Máximo:
10.484
1 jan 2010 ano
Na data de observação
Valor
Mudança absoluta
A alteração em relação ao valor anterior
1 jan 2001 ano
7.917
+7.917
0.0%
1 jan 2002 ano
5.58
-2.337
-29.52%
1 jan 2003 ano
4.259
-1.321
-23.68%
1 jan 2004 ano
3.774
-0.484
-11.37%
1 jan 2005 ano
3.492
-0.282
-7.47%
1 jan 2006 ano
6.726
+3.234
92.6%
1 jan 2007 ano
9.145
+2.418
35.96%
1 jan 2008 ano
10.314
+1.169
12.79%
1 jan 2009 ano
10.043
-0.271
-2.62%
1 jan 2010 ano
10.484
+0.44
4.38%
1 jan 2011 ano
9.855
-0.629
-6.0%
1 jan 2012 ano
9.78
-0.075
-0.76%
1 jan 2013 ano
9.544
-0.236
-2.41%
1 jan 2014 ano
9.385
-0.16
-1.67%
1 jan 2015 ano
10.061
+0.676
7.2%

Classificação de países por estatísticas atuais por anos