33
/pt/
AIzaSyB4mHJ5NPEv-XzF7P6NDYXjlkCWaeKw5bc
November 1, 2025
193260
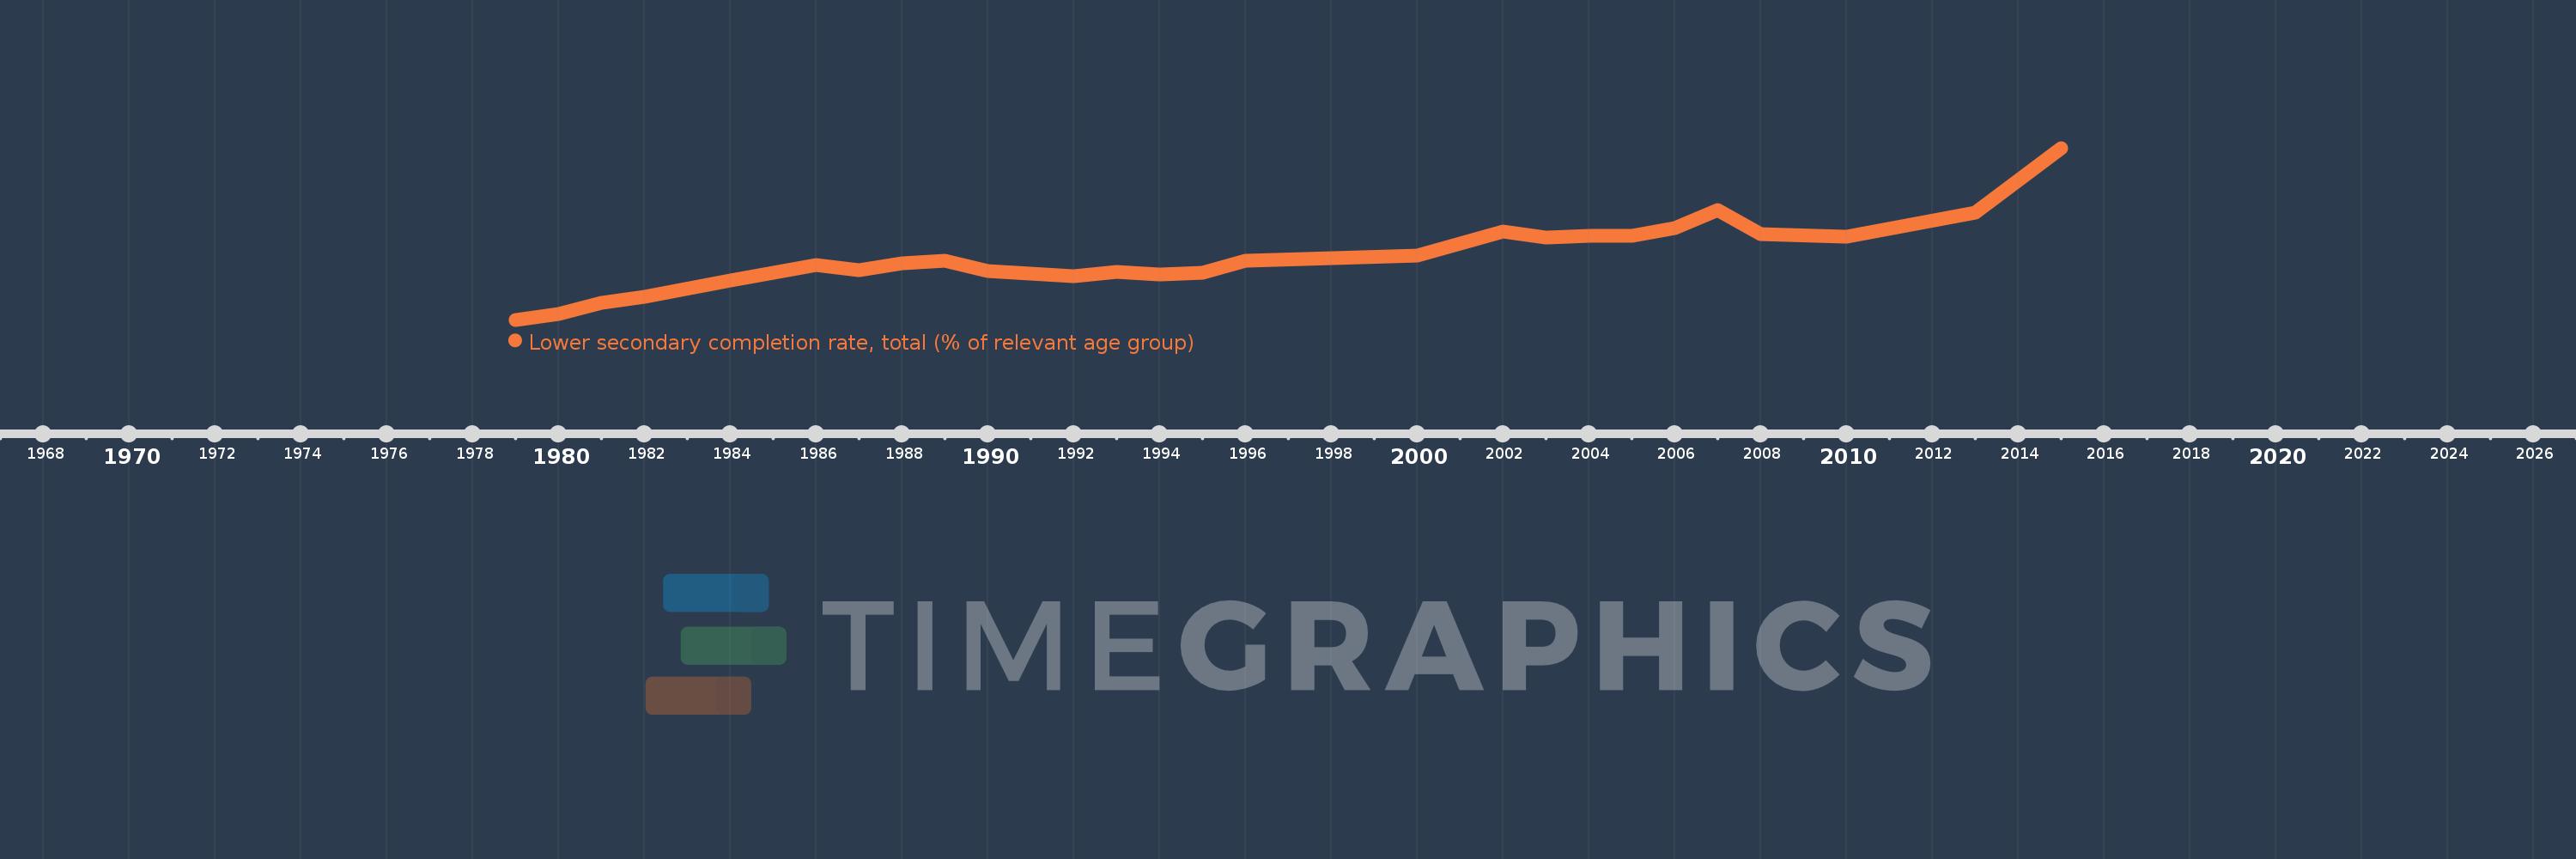
Mauritania
MRT
true
2
1
Lower secondary completion rate, total (% of relevant age group)
2015,2013,2010,2008,2007,2006,2005,2004,2003,2002,2000,1996,1995,1994,1993,1992,1990,1989,1988,1987,1986,1984,1982,1981,1980,1979