30
/pt/
AIzaSyAYiBZKx7MnpbEhh9jyipgxe19OcubqV5w
April 1, 2024
185291
Madagascar
MDG
true
2
1
IDA resource allocation index (1=low to 6=high)
2016,2015,2014,2013,2012,2011,2010,2009,2008,2007,2006
Download
Biblioteca de estatísticas globais →Madagascar →

IDA resource allocation index (1=low to 6=high)

Estas estatísticas em outros países:

AfghanistanAlbaniaAngolaArab WorldArmeniaAzerbaijanBangladeshBeninBhutanBoliviaBosnia and HerzegovinaBurkina FasoBurundiCabo VerdeCambodiaCameroonCaribbean small statesCentral African RepublicChadComorosCongo, Dem. Rep.Congo, Rep.Cote d'IvoireDjiboutiDominicaEarly-demographic dividendEast Asia & PacificEast Asia & Pacific (excluding high income)East Asia & Pacific (IDA & IBRD countries)EritreaEthiopiaEurope & Central AsiaEurope & Central Asia (excluding high income)Europe & Central Asia (IDA & IBRD countries)Fragile and conflict affected situationsGambia, TheGeorgiaGhanaGrenadaGuineaGuinea-BissauGuyanaHaitiHeavily indebted poor countries (HIPC)HondurasIBRD onlyIDA & IBRD totalIDA blendIDA onlyIDA totalIndiaIndonesiaKenyaKiribatiKosovoKyrgyz RepublicLao PDRLate-demographic dividendLatin America & Caribbean Latin America & Caribbean (excluding high income)Latin America & the Caribbean (IDA & IBRD countries)Least developed countries: UN classificationLesothoLiberiaLow & middle incomeLow incomeLower middle incomeMadagascarMalawiMaldivesMaliMarshall IslandsMauritaniaMicronesia, Fed. Sts.Middle East & North AfricaMiddle East & North Africa (excluding high income)Middle East & North Africa (IDA & IBRD countries)Middle incomeMoldovaMongoliaMozambiqueMyanmarNepalNicaraguaNigerNigeriaOther small statesPacific island small statesPakistanPapua New GuineaPost-demographic dividendPre-demographic dividendRwandaSamoaSao Tome and PrincipeSenegalSerbiaSierra LeoneSmall statesSolomon IslandsSouth AsiaSouth Asia (IDA & IBRD)South SudanSri LankaSt. LuciaSt. Vincent and the GrenadinesSub-Saharan Africa Sub-Saharan Africa (excluding high income)Sub-Saharan Africa (IDA & IBRD countries)SudanTajikistanTanzaniaTimor-LesteTogoTongaTuvaluUgandaUpper middle incomeUzbekistanVanuatuVietnamWorldYemen, Rep.ZambiaZimbabwe

Linha do tempo:

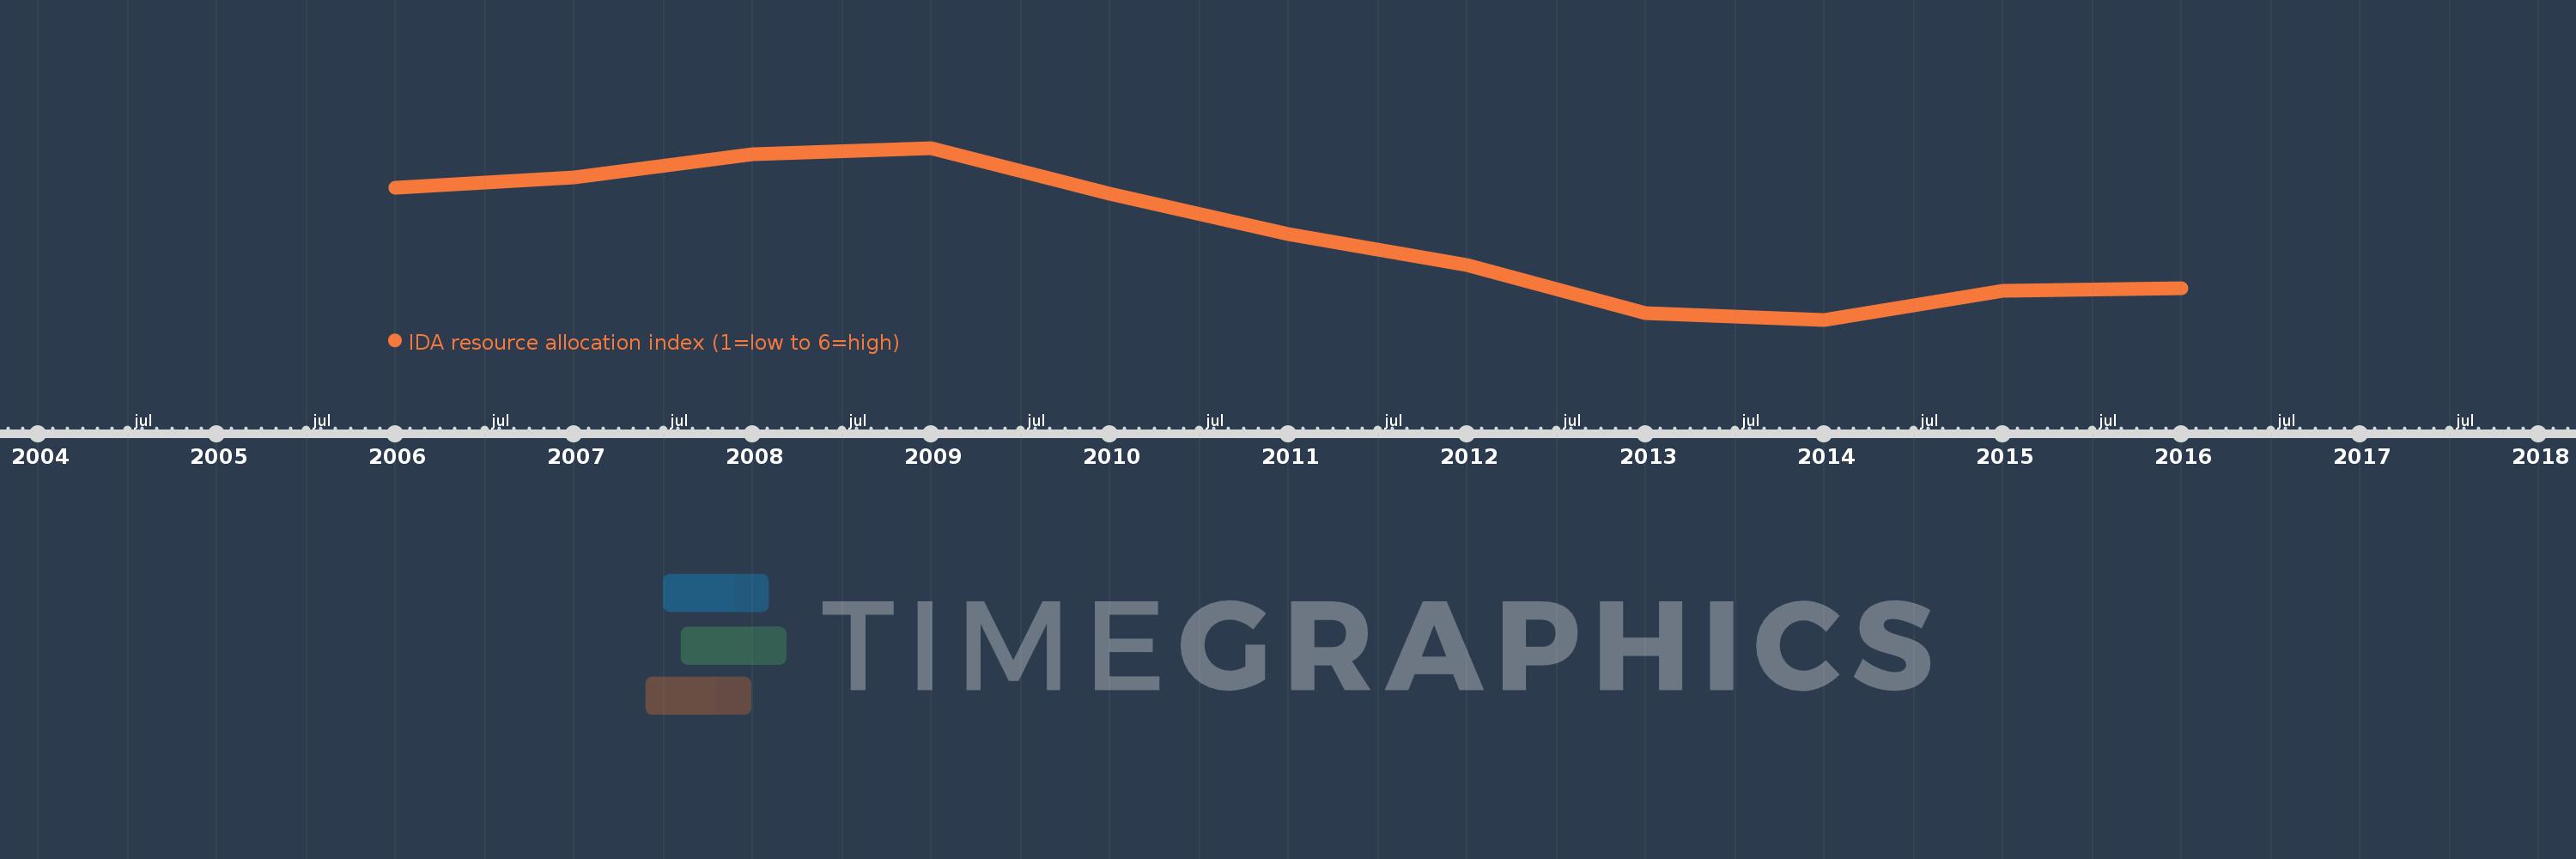
Nesta escala de tempo está apresentado um gráfico de 2006 ano até 2016 ano Madagascar. Dados de 2005 ano ausente. O número de observações reais por data: 11.

Fonte (nome):

Indicadores de desenvolvimento mundial

Fonte (organização):

World Bank Group, CPIA database (http://www.worldbank.org/ida).

Categorias:

Public Sector

Foi atualizado:

23 abr 2017 ano

Indicadores de alterações dos valores ao longo dos anos

Em média:
3.358
Mínimo:
3.017
1 jan 2014 ano
Máximo:
3.7
1 jan 2009 ano
Na data de observação
Valor
Mudança absoluta
A alteração em relação ao valor anterior
1 jan 2006 ano
3.542
+3.542
0.0%
1 jan 2007 ano
3.583
+0.042
1.18%
1 jan 2008 ano
3.675
+0.092
2.56%
1 jan 2009 ano
3.7
+0.025
0.68%
1 jan 2010 ano
3.517
-0.183
-4.95%
1 jan 2011 ano
3.358
-0.158
-4.5%
1 jan 2012 ano
3.233
-0.125
-3.72%
1 jan 2013 ano
3.042
-0.192
-5.93%
1 jan 2014 ano
3.017
-0.025
-0.82%
1 jan 2015 ano
3.133
+0.117
3.87%
1 jan 2016 ano
3.142
+0.008
0.27%

Classificação de países por estatísticas atuais por anos