33
/pt/
AIzaSyAYiBZKx7MnpbEhh9jyipgxe19OcubqV5w
August 1, 2025
181725
Lithuania
LTU
true
2
1
Transport services (% of service exports, BoP)
2016,2015,2014,2013,2012,2011,2010,2009,2008,2007,2006,2005,2004,2003,2002,2001,2000,1999,1998,1997,1996,1995,1994
Download
Biblioteca de estatísticas globais →Lithuania →

Transport services (% of service exports, BoP)

Estas estatísticas em outros países:

AfghanistanAlbaniaAlgeriaAngolaAntigua and BarbudaArab WorldArgentinaArmeniaArubaAustraliaAustriaAzerbaijanBahamas, TheBahrainBangladeshBarbadosBelarusBelgiumBelizeBeninBermudaBhutanBoliviaBosnia and HerzegovinaBotswanaBrazilBrunei DarussalamBulgariaBurkina FasoBurundiCabo VerdeCambodiaCameroonCanadaCaribbean small statesCentral African RepublicCentral Europe and the BalticsChadChileChinaColombiaComorosCongo, Dem. Rep.Congo, Rep.Costa RicaCote d'IvoireCroatiaCuracaoCyprusCzech RepublicDenmarkDjiboutiDominicaDominican RepublicEarly-demographic dividendEast Asia & PacificEast Asia & Pacific (excluding high income)East Asia & Pacific (IDA & IBRD countries)EcuadorEgypt, Arab Rep.El SalvadorEritreaEstoniaEthiopiaEuro areaEurope & Central AsiaEurope & Central Asia (excluding high income)Europe & Central Asia (IDA & IBRD countries)European UnionFaroe IslandsFijiFinlandFragile and conflict affected situationsFranceFrench PolynesiaGabonGambia, TheGeorgiaGermanyGhanaGreeceGrenadaGuatemalaGuineaGuinea-BissauGuyanaHaitiHeavily indebted poor countries (HIPC)High incomeHondurasHong Kong SAR, ChinaHungaryIBRD onlyIcelandIDA & IBRD totalIDA onlyIDA totalIndiaIndonesiaIran, Islamic Rep.IraqIrelandIsraelItalyJamaicaJapanJordanKazakhstanKenyaKiribatiKorea, Rep.KosovoKuwaitKyrgyz RepublicLao PDRLate-demographic dividendLatin America & Caribbean Latin America & Caribbean (excluding high income)Latin America & the Caribbean (IDA & IBRD countries)LatviaLeast developed countries: UN classificationLebanonLesothoLiberiaLibyaLithuaniaLow & middle incomeLow incomeLower middle incomeLuxembourgMacao SAR, ChinaMacedonia, FYRMadagascarMalawiMalaysiaMaldivesMaliMaltaMarshall IslandsMauritaniaMauritiusMexicoMicronesia, Fed. Sts.Middle East & North AfricaMiddle East & North Africa (excluding high income)Middle East & North Africa (IDA & IBRD countries)Middle incomeMoldovaMongoliaMontenegroMoroccoMozambiqueMyanmarNamibiaNepalNetherlandsNew CaledoniaNew ZealandNicaraguaNigerNigeriaNorth AmericaNorwayOECD membersOmanOther small statesPacific island small statesPakistanPalauPanamaPapua New GuineaParaguayPeruPhilippinesPolandPortugalPost-demographic dividendPre-demographic dividendQatarRomaniaRussian FederationRwandaSamoaSao Tome and PrincipeSaudi ArabiaSenegalSerbiaSeychellesSierra LeoneSingaporeSint Maarten (Dutch part)Slovak RepublicSloveniaSmall statesSolomon IslandsSouth AfricaSouth AsiaSouth Asia (IDA & IBRD)South SudanSpainSri LankaSt. Kitts and NevisSt. LuciaSt. Vincent and the GrenadinesSub-Saharan Africa Sub-Saharan Africa (excluding high income)Sub-Saharan Africa (IDA & IBRD countries)SudanSurinameSwazilandSwedenSwitzerlandSyrian Arab RepublicTajikistanTanzaniaThailandTimor-LesteTogoTongaTrinidad and TobagoTunisiaTurkeyTuvaluUgandaUkraineUnited KingdomUnited StatesUpper middle incomeUruguayVanuatuVenezuela, RBWest Bank and GazaWorldYemen, Rep.ZambiaZimbabwe

Linha do tempo:

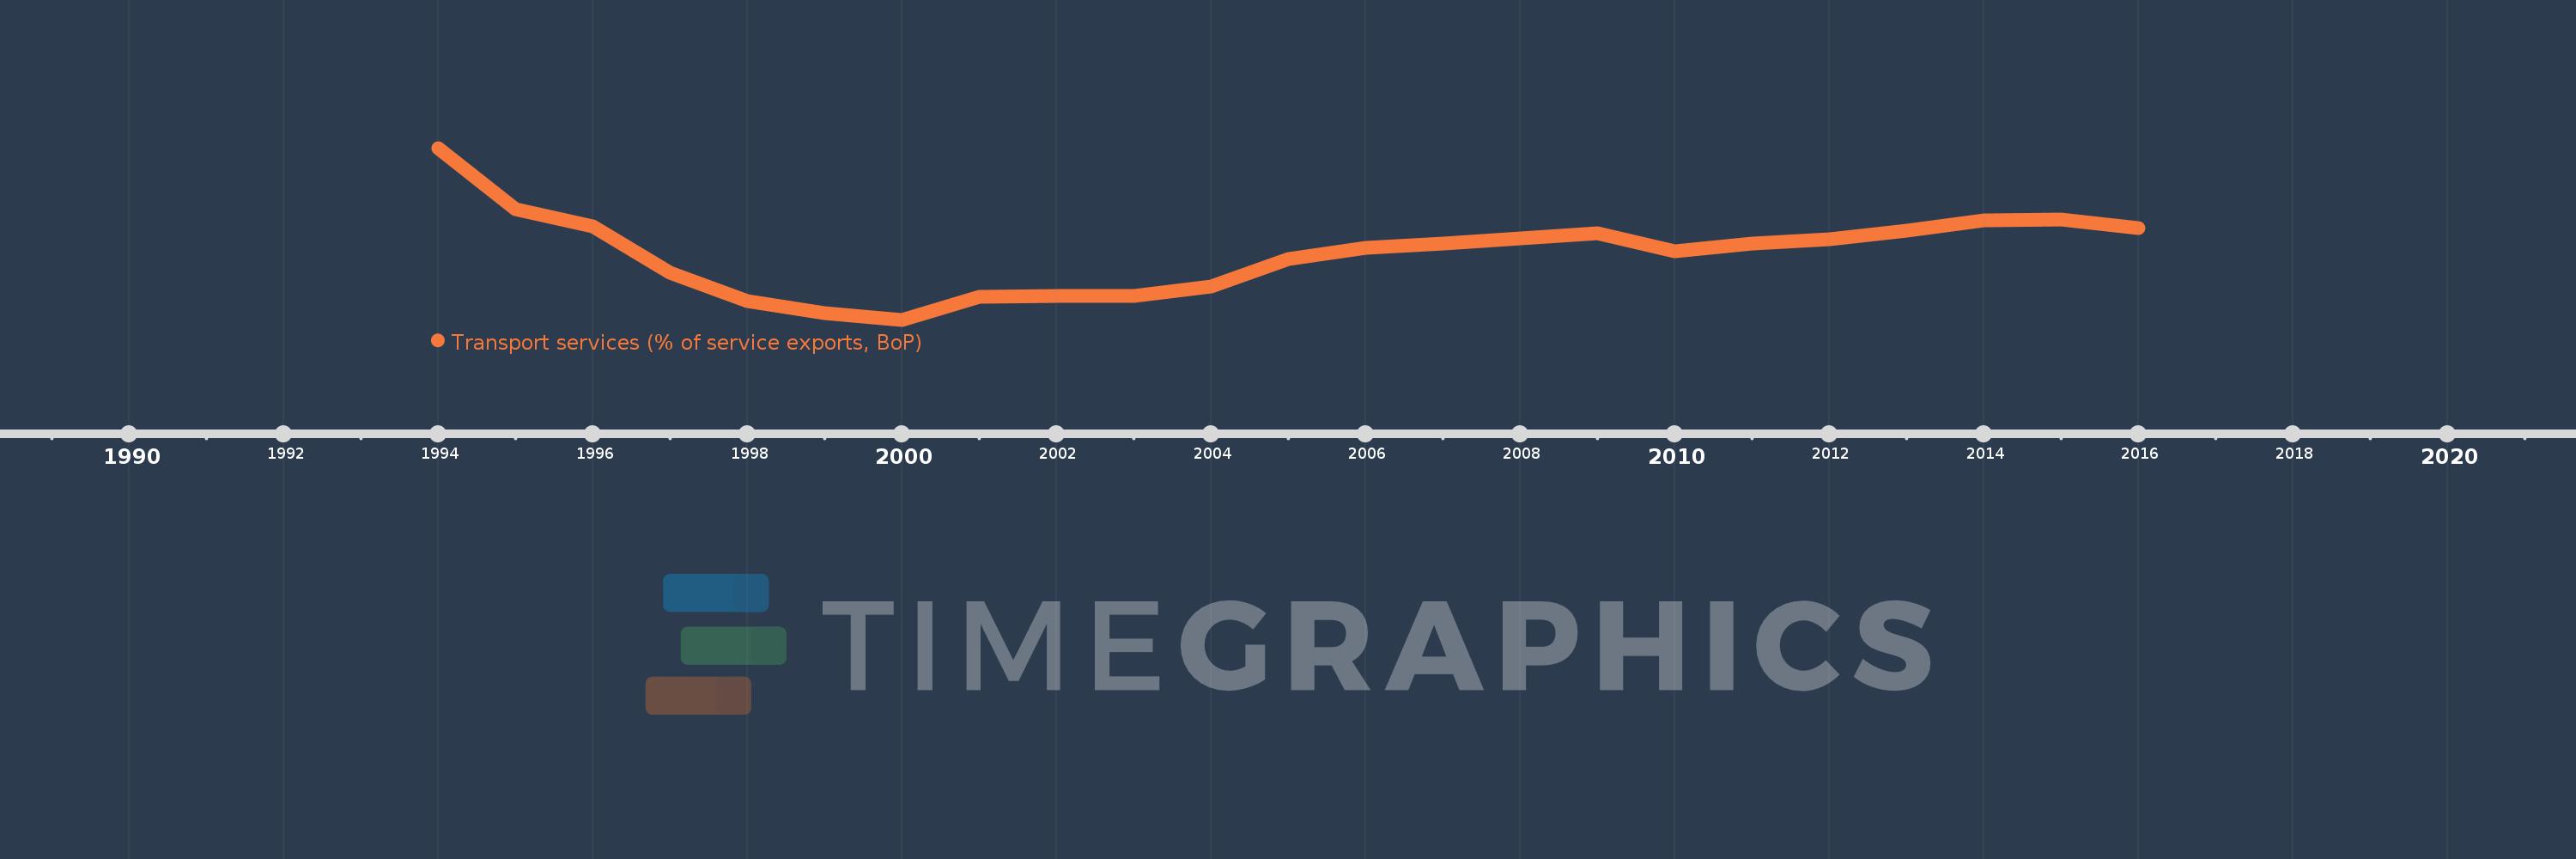
Nesta escala de tempo está apresentado um gráfico de 1994 ano até 2016 ano Lithuania. Dados de 1993 ano ausente. O número de observações reais por data: 23.

Fonte (nome):

Indicadores de desenvolvimento mundial

Fonte (organização):

International Monetary Fund, Balance of Payments Statistics Yearbook and data files.

Categorias:

Economy & Growth, Trade

Foi atualizado:

23 abr 2017 ano

Indicadores de alterações dos valores ao longo dos anos

Em média:
50.951
Mínimo:
30.221
1 jan 2000 ano
Máximo:
83.641
1 jan 1994 ano
Na data de observação
Valor
Mudança absoluta
A alteração em relação ao valor anterior
1 jan 1994 ano
83.641
+83.641
0.0%
1 jan 1995 ano
64.493
-19.148
-22.89%
1 jan 1996 ano
59.251
-5.242
-8.13%
1 jan 1997 ano
44.942
-14.309
-24.15%
1 jan 1998 ano
36.067
-8.875
-19.75%
1 jan 1999 ano
32.201
-3.866
-10.72%
1 jan 2000 ano
30.221
-1.98
-6.15%
1 jan 2001 ano
37.22
+6.999
23.16%
1 jan 2002 ano
37.638
+0.418
1.12%
1 jan 2003 ano
37.572
-0.066
-0.18%
1 jan 2004 ano
40.609
+3.037
8.08%
1 jan 2005 ano
49.164
+8.556
21.07%
1 jan 2006 ano
52.471
+3.307
6.73%
1 jan 2007 ano
53.973
+1.502
2.86%
1 jan 2008 ano
55.617
+1.644
3.05%
1 jan 2009 ano
57.032
+1.414
2.54%
1 jan 2010 ano
51.476
-5.556
-9.74%
1 jan 2011 ano
53.823
+2.347
4.56%
1 jan 2012 ano
55.258
+1.436
2.67%
1 jan 2013 ano
58.014
+2.755
4.99%
1 jan 2014 ano
61.173
+3.159
5.45%
1 jan 2015 ano
61.37
+0.197
0.32%
1 jan 2016 ano
58.658
-2.711
-4.42%

Classificação de países por estatísticas atuais por anos