33
/pt/
AIzaSyAYiBZKx7MnpbEhh9jyipgxe19OcubqV5w
August 1, 2025
174255
Lao PDR
LAO
true
2
1
Industry, value added (% of GDP)
2016,2015,2014,2013,2012,2011,2010,2009,2008,2007,2006,2005,2004,2003,2002,2001,2000,1999,1998,1997,1996,1995,1994,1993,1992,1991,1990
Download
Biblioteca de estatísticas globais →Lao PDR →

Industry, value added (% of GDP)

Estas estatísticas em outros países:

AfghanistanAlbaniaAlgeriaAndorraAngolaAntigua and BarbudaArab WorldArgentinaArmeniaArubaAustraliaAustriaAzerbaijanBahamas, TheBahrainBangladeshBarbadosBelarusBelgiumBelizeBeninBermudaBhutanBoliviaBosnia and HerzegovinaBotswanaBrazilBrunei DarussalamBulgariaBurkina FasoBurundiCabo VerdeCambodiaCameroonCanadaCaribbean small statesCayman IslandsCentral African RepublicCentral Europe and the BalticsChadChileChinaColombiaComorosCongo, Dem. Rep.Congo, Rep.Costa RicaCote d'IvoireCroatiaCubaCyprusCzech RepublicDenmarkDjiboutiDominicaDominican RepublicEarly-demographic dividendEast Asia & PacificEast Asia & Pacific (excluding high income)East Asia & Pacific (IDA & IBRD countries)EcuadorEgypt, Arab Rep.El SalvadorEquatorial GuineaEritreaEstoniaEthiopiaEuro areaEurope & Central AsiaEurope & Central Asia (excluding high income)Europe & Central Asia (IDA & IBRD countries)European UnionFijiFinlandFragile and conflict affected situationsFranceGabonGambia, TheGeorgiaGermanyGhanaGreeceGrenadaGuatemalaGuineaGuinea-BissauGuyanaHeavily indebted poor countries (HIPC)High incomeHondurasHong Kong SAR, ChinaHungaryIBRD onlyIcelandIDA & IBRD totalIDA blendIDA onlyIDA totalIndiaIndonesiaIran, Islamic Rep.IrelandItalyJamaicaJapanJordanKazakhstanKenyaKiribatiKorea, Rep.KosovoKuwaitKyrgyz RepublicLao PDRLate-demographic dividendLatin America & Caribbean Latin America & Caribbean (excluding high income)Latin America & the Caribbean (IDA & IBRD countries)LatviaLeast developed countries: UN classificationLebanonLesothoLibyaLiechtensteinLithuaniaLow & middle incomeLow incomeLower middle incomeLuxembourgMacao SAR, ChinaMacedonia, FYRMadagascarMalawiMalaysiaMaldivesMaliMaltaMarshall IslandsMauritaniaMauritiusMexicoMicronesia, Fed. Sts.Middle East & North AfricaMiddle East & North Africa (excluding high income)Middle East & North Africa (IDA & IBRD countries)Middle incomeMoldovaMongoliaMontenegroMoroccoMozambiqueMyanmarNamibiaNepalNetherlandsNew CaledoniaNew ZealandNicaraguaNigerNigeriaNorth AmericaNorwayOECD membersOmanOther small statesPacific island small statesPakistanPalauPanamaPapua New GuineaParaguayPeruPhilippinesPolandPortugalPost-demographic dividendPre-demographic dividendPuerto RicoQatarRomaniaRussian FederationRwandaSao Tome and PrincipeSaudi ArabiaSenegalSerbiaSeychellesSierra LeoneSingaporeSlovak RepublicSloveniaSmall statesSolomon IslandsSomaliaSouth AfricaSouth AsiaSouth Asia (IDA & IBRD)SpainSri LankaSt. Kitts and NevisSt. LuciaSt. Vincent and the GrenadinesSub-Saharan Africa Sub-Saharan Africa (excluding high income)Sub-Saharan Africa (IDA & IBRD countries)SudanSurinameSwazilandSwedenSwitzerlandSyrian Arab RepublicTajikistanTanzaniaThailandTimor-LesteTogoTongaTrinidad and TobagoTunisiaTurkeyTurkmenistanTuvaluUgandaUkraineUnited KingdomUnited StatesUpper middle incomeUruguayUzbekistanVanuatuVenezuela, RBVietnamWest Bank and GazaWorldYemen, Rep.ZambiaZimbabwe

Linha do tempo:

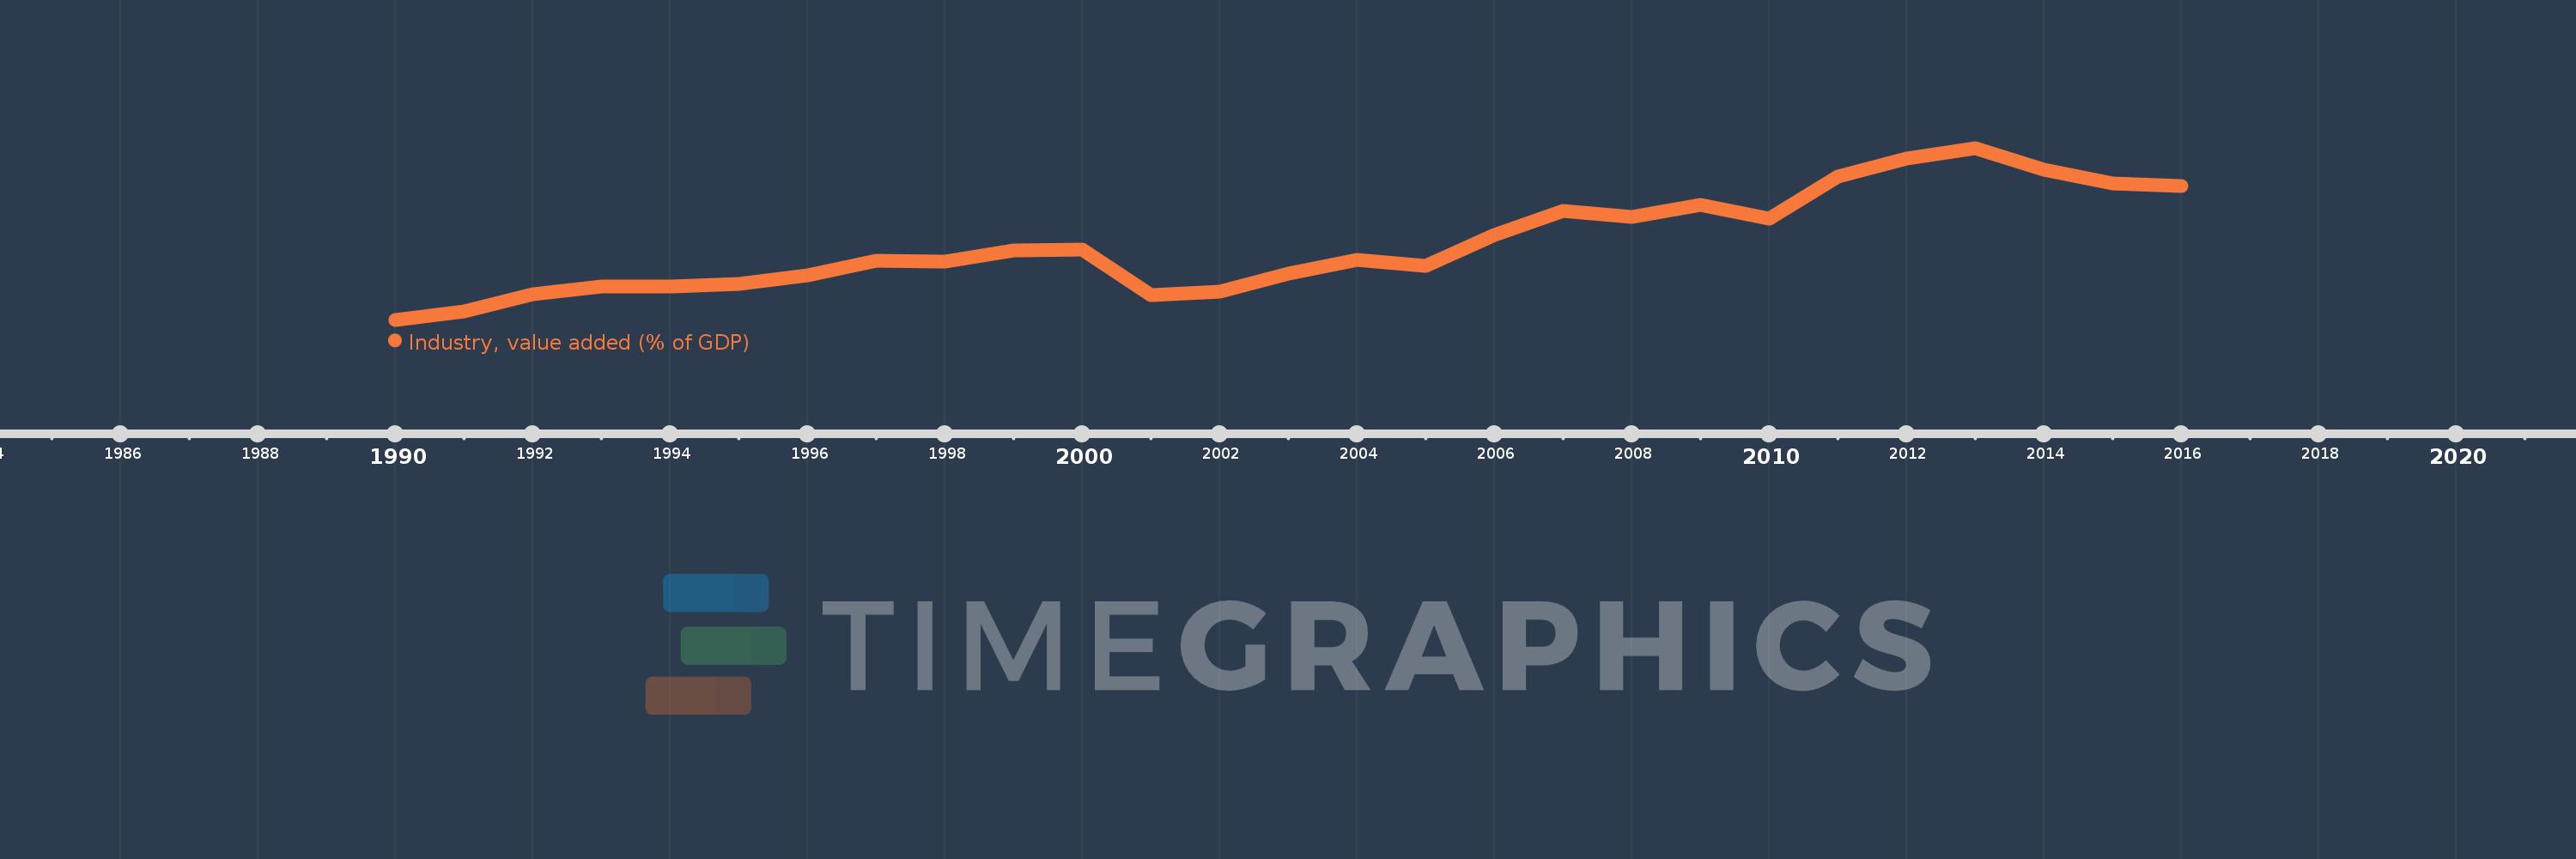
Nesta escala de tempo está apresentado um gráfico de 1990 ano até 2016 ano Lao PDR. Dados de 1989 ano ausente. O número de observações reais por data: 27.

Fonte (nome):

Indicadores de desenvolvimento mundial

Fonte (organização):

World Bank national accounts data, and OECD National Accounts data files.

Categorias:

Economy & Growth

Foi atualizado:

23 abr 2017 ano

Indicadores de alterações dos valores ao longo dos anos

Em média:
23.439
Mínimo:
13.421
1 jan 1990 ano
Máximo:
36.009
1 jan 2013 ano
Na data de observação
Valor
Mudança absoluta
A alteração em relação ao valor anterior
1 jan 1990 ano
13.421
+13.421
0.0%
1 jan 1991 ano
14.508
+1.087
8.1%
1 jan 1992 ano
16.816
+2.308
15.91%
1 jan 1993 ano
17.757
+0.941
5.59%
1 jan 1994 ano
17.743
-0.013
-0.07%
1 jan 1995 ano
18.141
+0.397
2.24%
1 jan 1996 ano
19.241
+1.101
6.07%
1 jan 1997 ano
21.148
+1.906
9.91%
1 jan 1998 ano
21.048
-0.1
-0.47%
1 jan 1999 ano
22.499
+1.451
6.89%
1 jan 2000 ano
22.634
+0.135
0.6%
1 jan 2001 ano
16.606
-6.028
-26.63%
1 jan 2002 ano
17.148
+0.542
3.26%
1 jan 2003 ano
19.478
+2.33
13.59%
1 jan 2004 ano
21.319
+1.841
9.45%
1 jan 2005 ano
20.513
-0.806
-3.78%
1 jan 2006 ano
24.613
+4.1
19.99%
1 jan 2007 ano
27.735
+3.122
12.69%
1 jan 2008 ano
26.906
-0.829
-2.99%
1 jan 2009 ano
28.555
+1.649
6.13%
1 jan 2010 ano
26.662
-1.893
-6.63%
1 jan 2011 ano
32.294
+5.632
21.12%
1 jan 2012 ano
34.594
+2.3
7.12%
1 jan 2013 ano
36.009
+1.415
4.09%
1 jan 2014 ano
33.182
-2.827
-7.85%
1 jan 2015 ano
31.342
-1.84
-5.55%
1 jan 2016 ano
30.95
-0.392
-1.25%

Classificação de países por estatísticas atuais por anos