33
/pt/
AIzaSyAYiBZKx7MnpbEhh9jyipgxe19OcubqV5w
August 1, 2025
173738
Lao PDR
LAO
true
2
1
Adjusted net savings, excluding particulate emission damage (% of GNI)
2014,2013,2012,2011,2010,2009,2008,2007,2006,2005,2004,2003,2002,2001,1989,1988,1987,1986,1985
Download
Biblioteca de estatísticas globais →Lao PDR →

Adjusted net savings, excluding particulate emission damage (% of GNI)

Estas estatísticas em outros países:

AfghanistanAlbaniaAlgeriaAngolaArab WorldArgentinaArmeniaAustraliaAustriaAzerbaijanBahamas, TheBahrainBangladeshBarbadosBelarusBelgiumBelizeBeninBhutanBoliviaBotswanaBrazilBrunei DarussalamBulgariaBurkina FasoBurundiCabo VerdeCambodiaCameroonCanadaCaribbean small statesCentral African RepublicCentral Europe and the BalticsChadChileChinaColombiaComorosCongo, Dem. Rep.Congo, Rep.Costa RicaCote d'IvoireCroatiaCyprusCzech RepublicDenmarkDjiboutiDominicaDominican RepublicEarly-demographic dividendEast Asia & PacificEast Asia & Pacific (excluding high income)East Asia & Pacific (IDA & IBRD countries)EcuadorEgypt, Arab Rep.El SalvadorEquatorial GuineaEritreaEstoniaEthiopiaEuro areaEurope & Central AsiaEurope & Central Asia (excluding high income)Europe & Central Asia (IDA & IBRD countries)European UnionFijiFinlandFragile and conflict affected situationsFranceGabonGambia, TheGeorgiaGermanyGhanaGreeceGuatemalaGuineaGuinea-BissauGuyanaHaitiHeavily indebted poor countries (HIPC)High incomeHondurasHungaryIBRD onlyIcelandIDA & IBRD totalIDA blendIDA onlyIDA totalIndiaIndonesiaIran, Islamic Rep.IraqIrelandIsraelItalyJamaicaJapanJordanKazakhstanKenyaKiribatiKorea, Rep.KuwaitKyrgyz RepublicLao PDRLate-demographic dividendLatin America & Caribbean Latin America & Caribbean (excluding high income)Latin America & the Caribbean (IDA & IBRD countries)LatviaLeast developed countries: UN classificationLebanonLesothoLiberiaLibyaLithuaniaLow & middle incomeLow incomeLower middle incomeLuxembourgMacedonia, FYRMadagascarMalawiMalaysiaMaldivesMaliMauritaniaMauritiusMexicoMiddle East & North AfricaMiddle East & North Africa (excluding high income)Middle East & North Africa (IDA & IBRD countries)Middle incomeMoldovaMongoliaMoroccoMozambiqueNamibiaNepalNetherlandsNew ZealandNicaraguaNigerNigeriaNorth AmericaNorwayOECD membersOmanOther small statesPacific island small statesPakistanPanamaPapua New GuineaParaguayPeruPhilippinesPolandPortugalPost-demographic dividendPre-demographic dividendQatarRomaniaRussian FederationRwandaSaudi ArabiaSenegalSeychellesSierra LeoneSingaporeSlovak RepublicSloveniaSmall statesSolomon IslandsSouth AfricaSouth AsiaSouth Asia (IDA & IBRD)SpainSri LankaSt. LuciaSt. Vincent and the GrenadinesSub-Saharan Africa Sub-Saharan Africa (excluding high income)Sub-Saharan Africa (IDA & IBRD countries)SudanSurinameSwazilandSwedenSwitzerlandSyrian Arab RepublicTajikistanTanzaniaThailandTogoTongaTrinidad and TobagoTunisiaTurkeyUgandaUkraineUnited KingdomUnited StatesUpper middle incomeUruguayVanuatuVenezuela, RBVietnamWorldYemen, Rep.ZambiaZimbabwe

Linha do tempo:

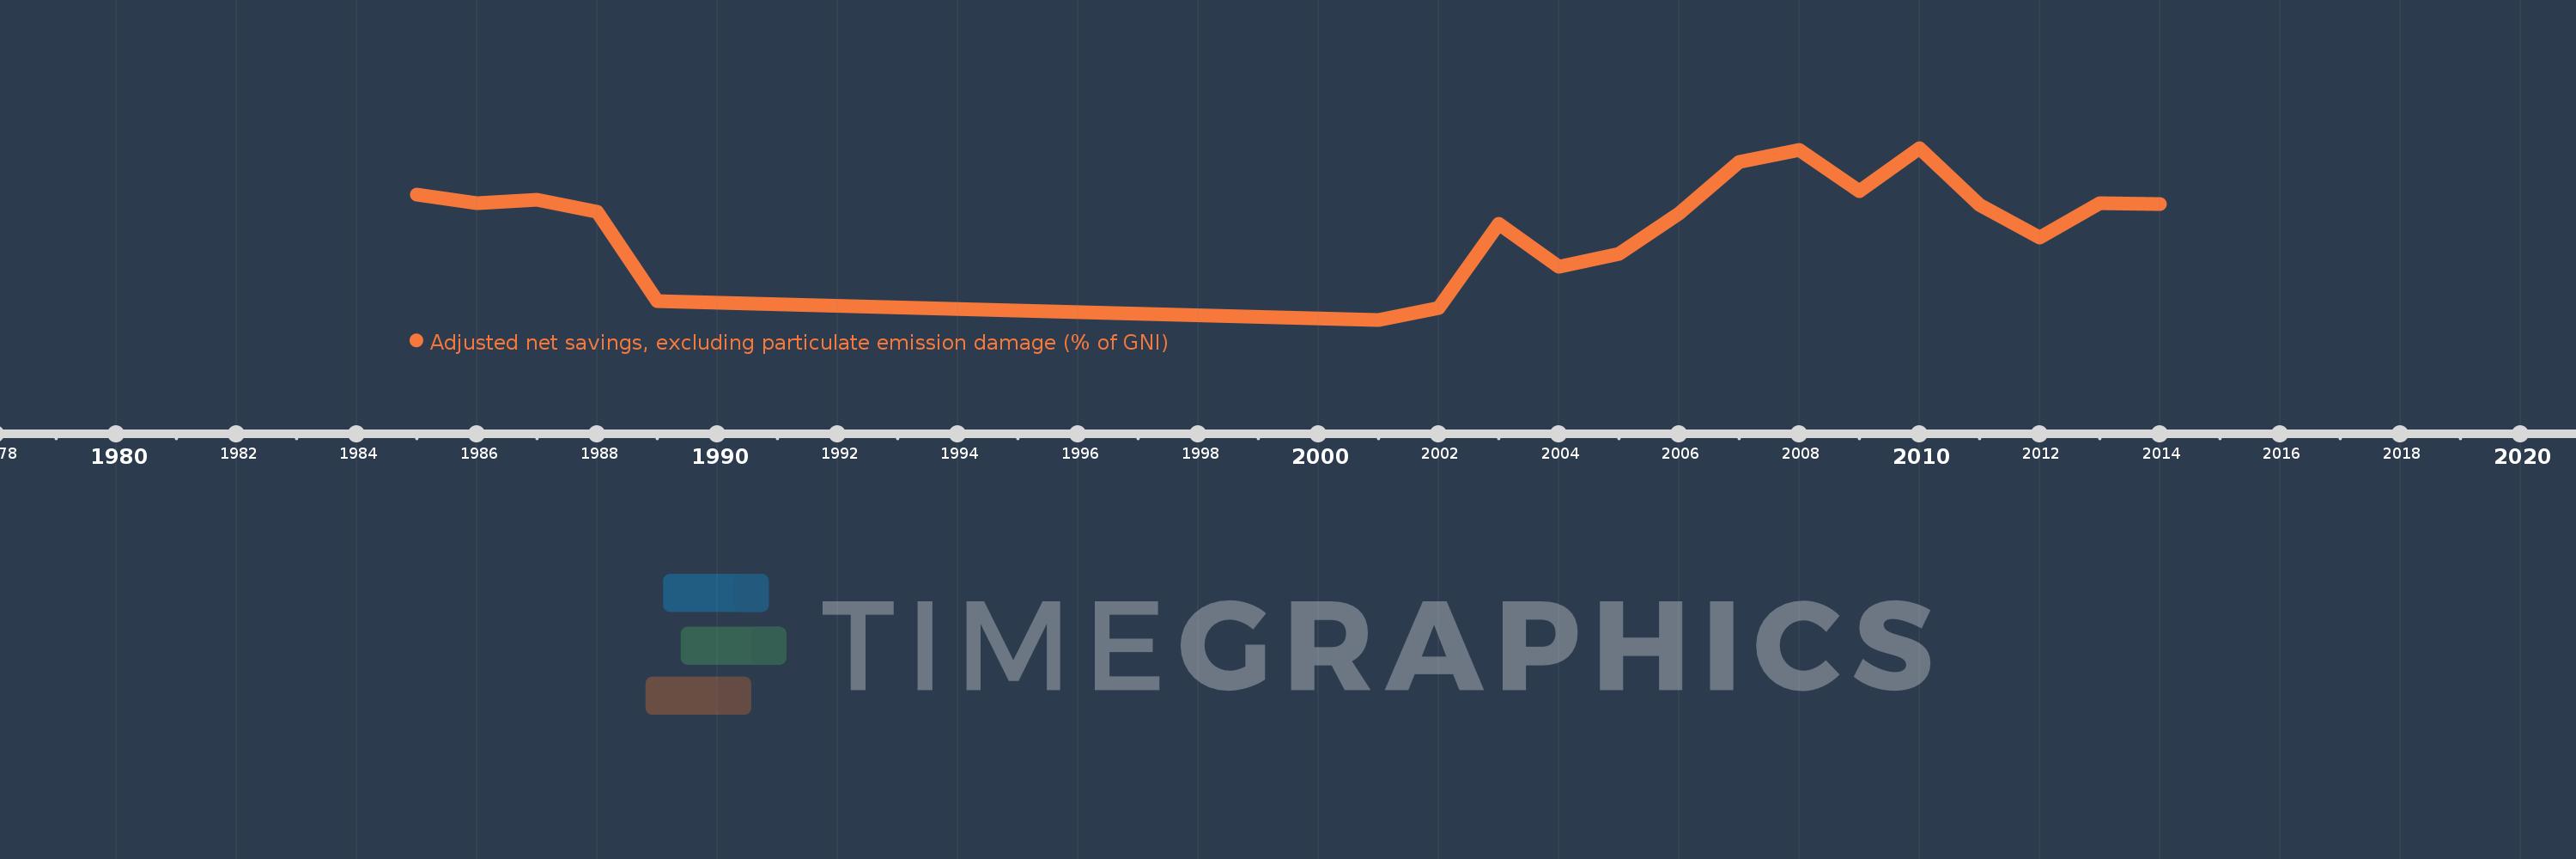
Nesta escala de tempo está apresentado um gráfico de 1985 ano até 2014 ano Lao PDR. Dados de 1984 ano ausente. O número de observações reais por data: 19.

Fonte (nome):

Indicadores de desenvolvimento mundial

Fonte (organização):

World Bank staff estimates based on sources and methods in World Bank's "The Changing Wealth of Nations: Measuring Sustainable Development in the New Millennium" (2011).

Categorias:

Economy & Growth, Environment

Foi atualizado:

23 abr 2017 ano

Indicadores de alterações dos valores ao longo dos anos

Em média:
-4.76
Mínimo:
-14.504
1 jan 2001 ano
Máximo:
2.431
1 jan 2010 ano
Na data de observação
Valor
Mudança absoluta
A alteração em relação ao valor anterior
1 jan 1985 ano
-2.143
-2.143
0.0%
1 jan 1986 ano
-2.991
-0.847
39.53%
1 jan 1987 ano
-2.652
+0.339
-11.34%
1 jan 1988 ano
-3.897
-1.245
46.95%
1 jan 1989 ano
-12.707
-8.81
226.07%
1 jan 2001 ano
-14.504
-1.797
14.15%
1 jan 2002 ano
-13.336
+1.168
-8.05%
1 jan 2003 ano
-5.078
+8.258
-61.92%
1 jan 2004 ano
-9.272
-4.194
82.6%
1 jan 2005 ano
-7.998
+1.275
-13.75%
1 jan 2006 ano
-4.012
+3.986
-49.84%
1 jan 2007 ano
1.009
+5.021
-125.16%
1 jan 2008 ano
2.204
+1.195
118.41%
1 jan 2009 ano
-1.866
-4.07
-184.64%
1 jan 2010 ano
2.431
+4.297
-230.32%
1 jan 2011 ano
-3.153
-5.584
-229.68%
1 jan 2012 ano
-6.386
-3.233
102.54%
1 jan 2013 ano
-3.007
+3.379
-52.91%
1 jan 2014 ano
-3.077
-0.07
2.33%

Classificação de países por estatísticas atuais por anos