29
/pt/
pt
AIzaSyAYiBZKx7MnpbEhh9jyipgxe19OcubqV5w
April 1, 2024
169663
Korea, Rep.
KOR
true
2
1
Bank nonperforming loans to total gross loans (%)
2015,2014,2013,2012,2011,2010,2009,2008,2007,2006,2005,2004,2003,2002,2001,2000,1999,1998
Download
Biblioteca de estatísticas globais →Korea, Rep. →

Bank nonperforming loans to total gross loans (%)

Estas estatísticas em outros países:
AfghanistanAlbaniaAlgeriaAngolaArab WorldArgentinaArmeniaAustraliaAustriaAzerbaijanBahamas, TheBahrainBangladeshBelarusBelgiumBhutanBoliviaBosnia and HerzegovinaBotswanaBrazilBrunei DarussalamBulgariaBurundiCambodiaCameroonCanadaCaribbean small statesCentral Europe and the BalticsChileChinaColombiaComorosCongo, Rep.Costa RicaCroatiaCyprusCzech RepublicDenmarkDjiboutiDominican RepublicEarly-demographic dividendEast Asia & PacificEast Asia & Pacific (excluding high income)East Asia & Pacific (IDA & IBRD countries)EcuadorEgypt, Arab Rep.El SalvadorEstoniaEthiopiaEuro areaEurope & Central AsiaEurope & Central Asia (excluding high income)Europe & Central Asia (IDA & IBRD countries)European UnionFijiFinlandFranceGabonGeorgiaGermanyGhanaGreeceGrenadaGuatemalaGuineaHigh incomeHondurasHong Kong SAR, ChinaHungaryIBRD onlyIcelandIDA & IBRD totalIDA blendIDA totalIndiaIndonesiaIrelandIsraelItalyJamaicaJapanJordanKazakhstanKenyaKorea, Rep.KosovoKuwaitKyrgyz RepublicLate-demographic dividendLatin America & Caribbean Latin America & Caribbean (excluding high income)Latin America & the Caribbean (IDA & IBRD countries)LatviaLebanonLesothoLithuaniaLow & middle incomeLower middle incomeLuxembourgMacao SAR, ChinaMacedonia, FYRMadagascarMalaysiaMaldivesMaltaMauritaniaMauritiusMexicoMiddle East & North AfricaMiddle East & North Africa (excluding high income)Middle East & North Africa (IDA & IBRD countries)Middle incomeMoldovaMontenegroMoroccoMozambiqueNamibiaNetherlandsNew ZealandNicaraguaNigeriaNorth AmericaNorwayOECD membersOmanOther small statesPakistanPanamaParaguayPeruPhilippinesPolandPortugalPost-demographic dividendQatarRomaniaRussian FederationRwandaSamoaSan MarinoSaudi ArabiaSenegalSerbiaSeychellesSierra LeoneSingaporeSlovak RepublicSloveniaSmall statesSolomon IslandsSouth AfricaSouth AsiaSouth Asia (IDA & IBRD)SpainSri LankaSt. Vincent and the GrenadinesSub-Saharan Africa Sub-Saharan Africa (excluding high income)Sub-Saharan Africa (IDA & IBRD countries)SudanSwazilandSwedenSwitzerlandTajikistanTanzaniaThailandTongaTrinidad and TobagoTunisiaTurkeyTurkmenistanUgandaUkraineUnited Arab EmiratesUnited KingdomUnited StatesUpper middle incomeUruguayUzbekistanVanuatuVenezuela, RBVietnamWest Bank and GazaWorldYemen, Rep.ZambiaZimbabwe
Linha do tempo:
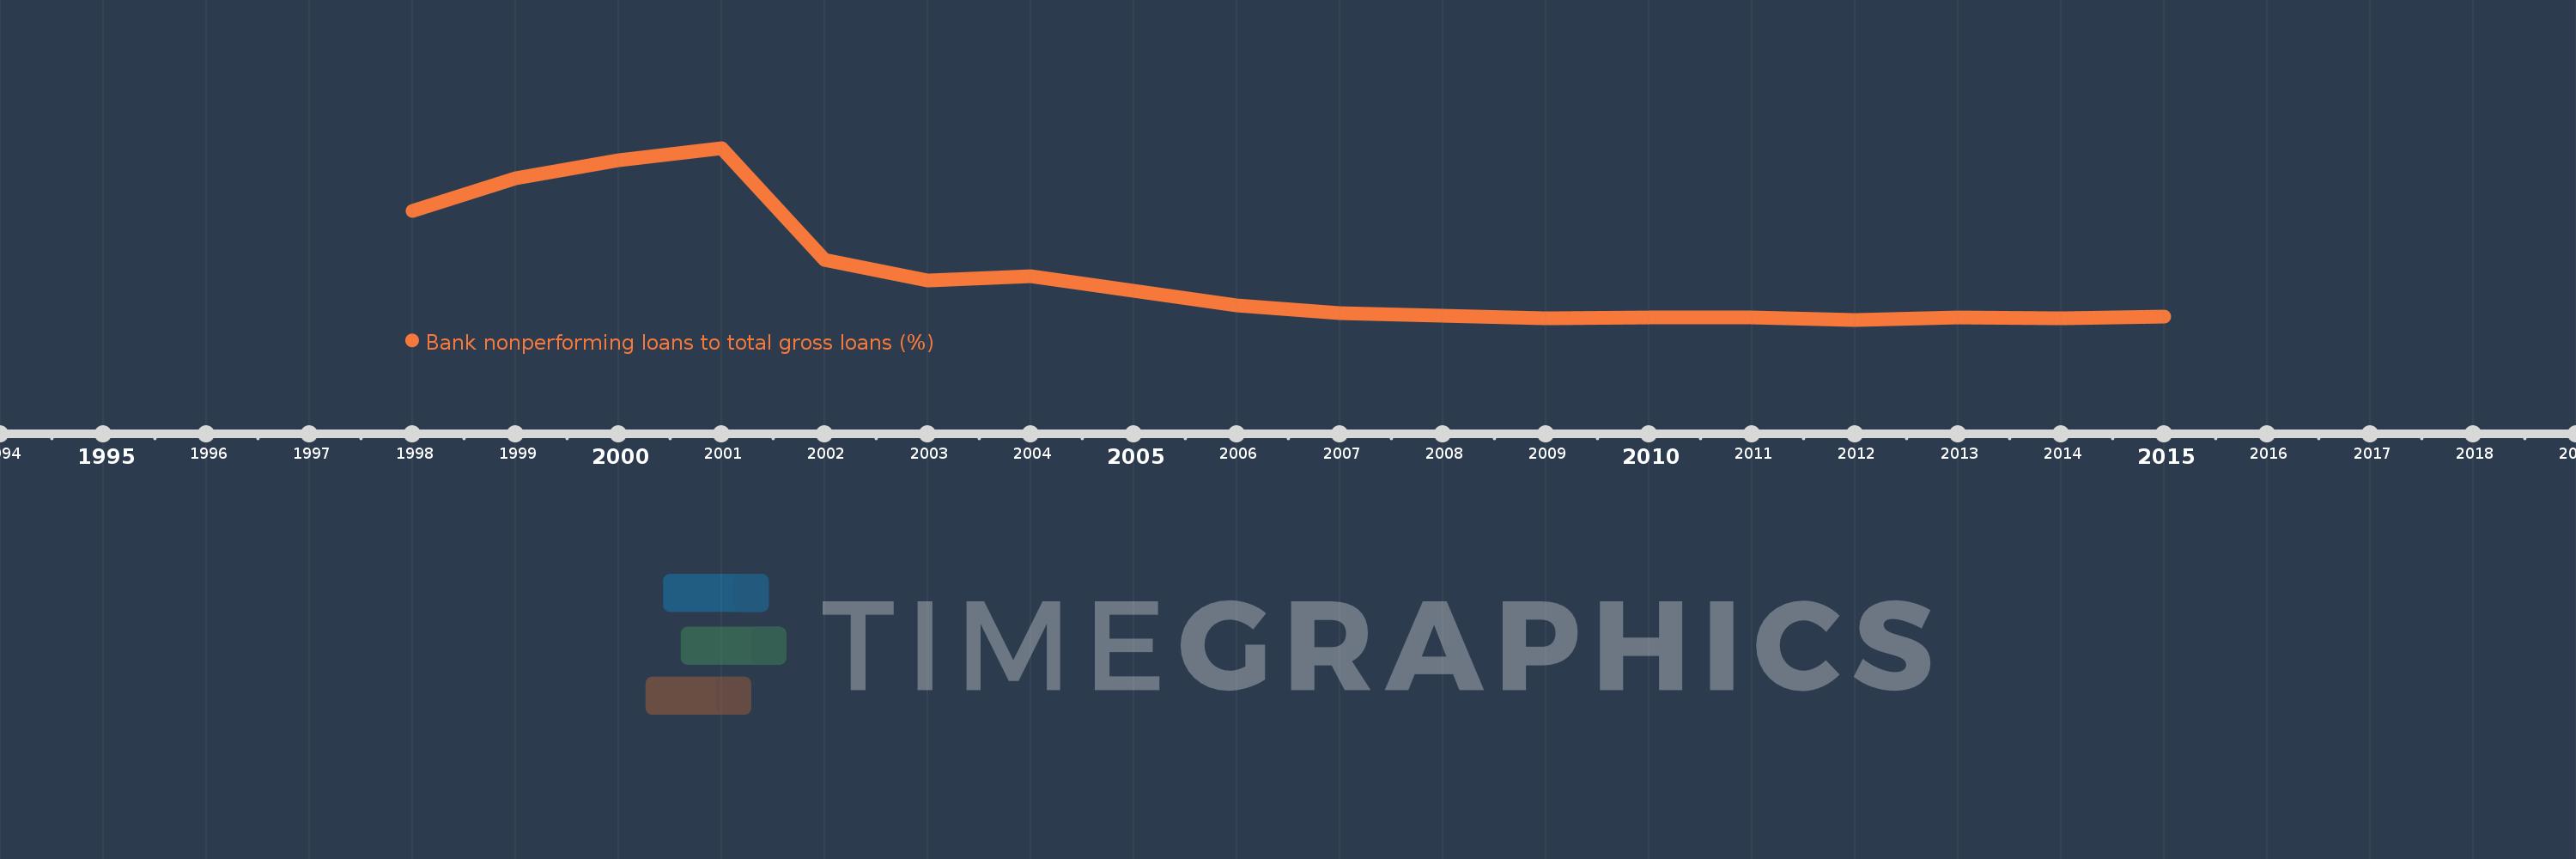
Nesta escala de tempo está apresentado um gráfico de 1998 ano até 2015 ano Korea, Rep.. Dados de 1997 ano ausente. O número de observações reais por data: 18.
Fonte (nome):
Indicadores de desenvolvimento mundial
Fonte (organização):
International Monetary Fund, Global Financial Stability Report.
Categorias:
Financial Sector
Foi atualizado:
23 abr 2017 ano
Indicadores de alterações dos valores ao longo dos anos
Em média:
2.634
Mínimo:
0.484
1 jan 2012 ano
Máximo:
8.9
1 jan 2001 ano
Na data de observação
Valor
Mudança absoluta
A alteração em relação ao valor anterior
1 jan 1998 ano
5.8
+5.8
0.0%
1 jan 1999 ano
7.4
+1.6
27.59%
1 jan 2000 ano
8.3
+0.9
12.16%
1 jan 2001 ano
8.9
+0.6
7.23%
1 jan 2002 ano
3.4
-5.5
-61.8%
1 jan 2003 ano
2.4
-1.0
-29.41%
1 jan 2004 ano
2.6
+0.2
8.33%
1 jan 2005 ano
1.9
-0.7
-26.92%
1 jan 2006 ano
1.2
-0.7
-36.84%
1 jan 2007 ano
0.8
-0.4
-33.33%
1 jan 2008 ano
0.7
-0.1
-12.5%
1 jan 2009 ano
0.572
-0.128
-18.3%
1 jan 2010 ano
0.585
+0.013
2.2%
1 jan 2011 ano
0.588
+0.004
0.6%
1 jan 2012 ano
0.484
-0.104
-17.66%
1 jan 2013 ano
0.594
+0.11
22.75%
1 jan 2014 ano
0.571
-0.024
-3.97%
1 jan 2015 ano
0.622
+0.051
8.95%
Classificação de países por estatísticas atuais por anos

Comentários:

Enviar
PremiumAbout & FeedbackAcordoPrivacidade
logo
© 2022 Selected Technologies LLC – Morgan Hill, California