33
/pt/
AIzaSyB4mHJ5NPEv-XzF7P6NDYXjlkCWaeKw5bc
November 1, 2025
169578
Korea, Rep.
KOR
true
2
1
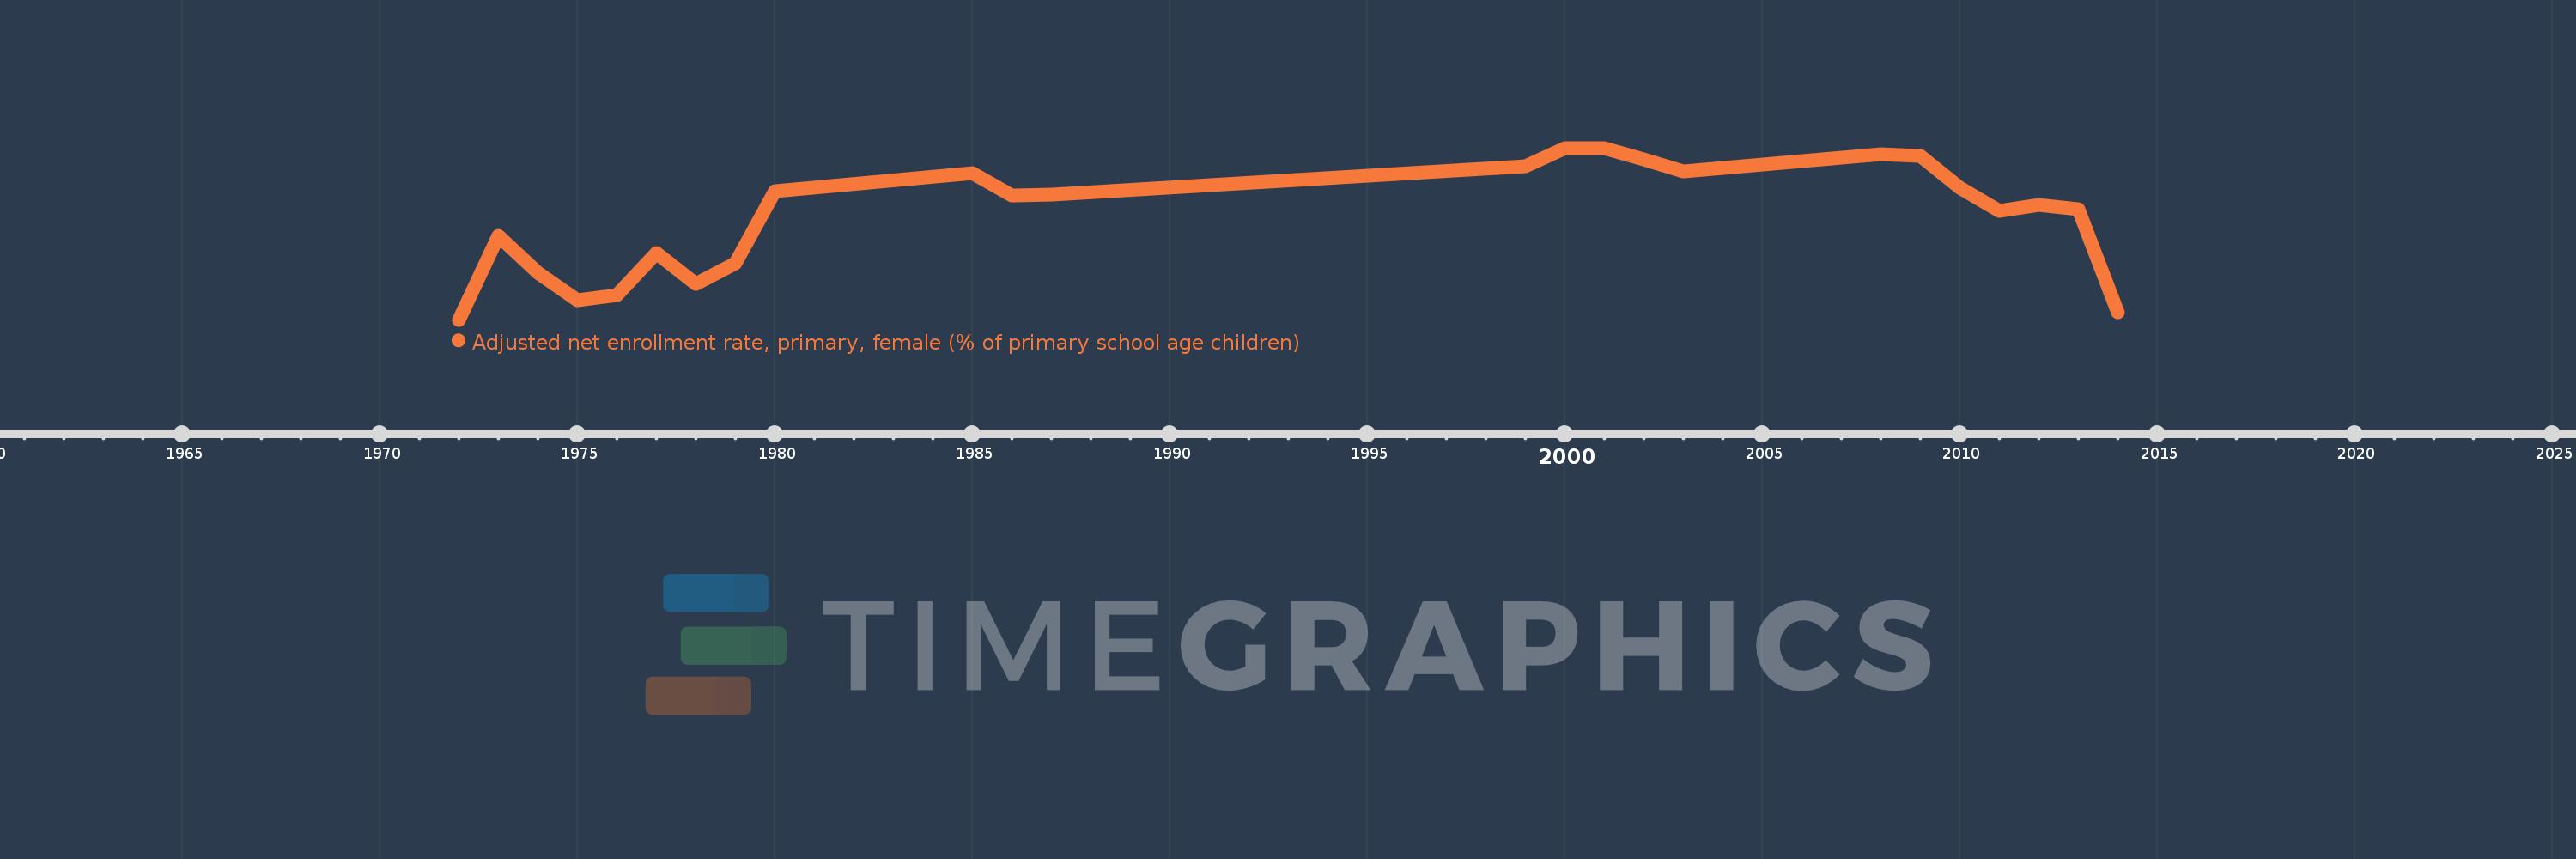
Adjusted net enrollment rate, primary, female (% of primary school age children)
2014,2013,2012,2011,2010,2009,2008,2003,2002,2001,2000,1999,1987,1986,1985,1980,1979,1978,1977,1976,1975,1974,1973,1972