33
/pt/
AIzaSyB4mHJ5NPEv-XzF7P6NDYXjlkCWaeKw5bc
November 1, 2025
164134
Japan
JPN
true
2
1
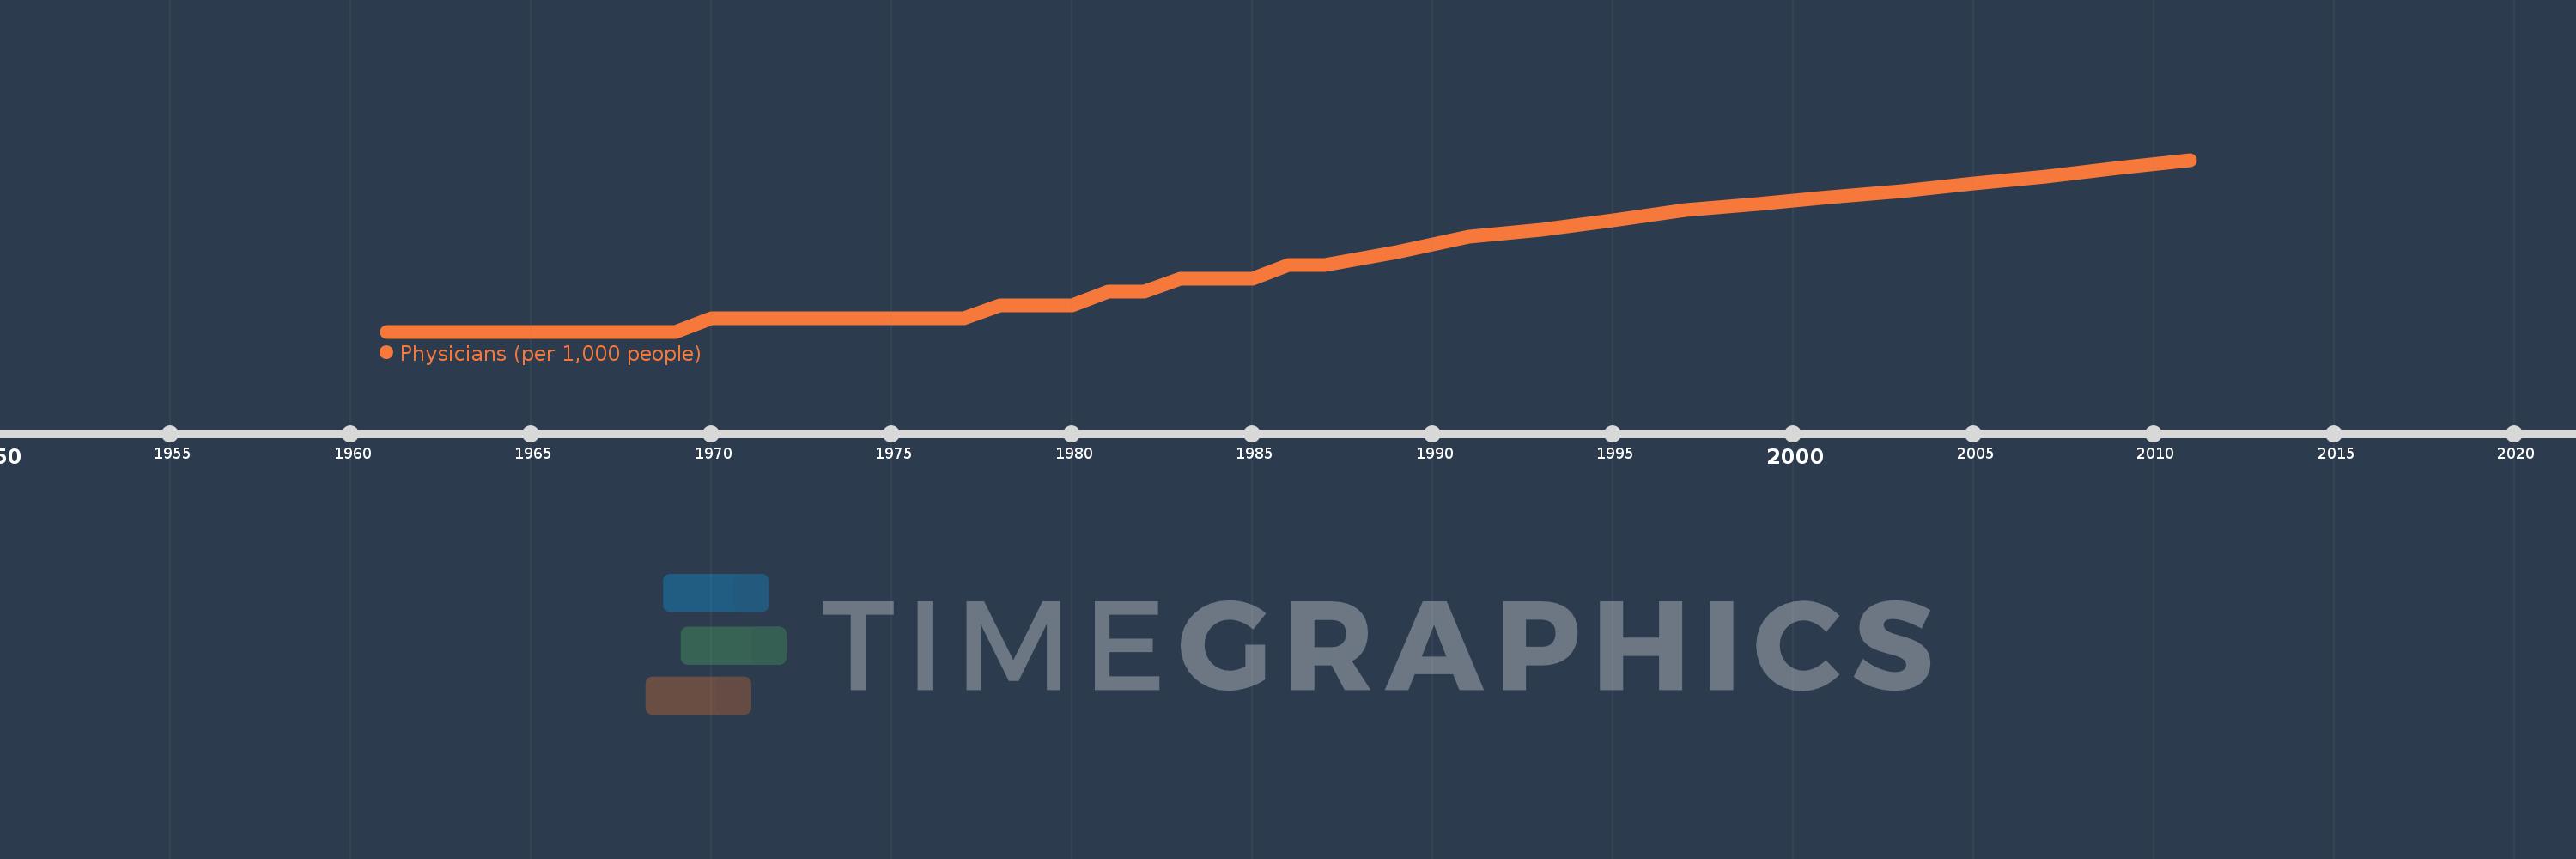
Physicians (per 1,000 people)
2011,2009,2007,2005,2003,2001,1999,1997,1995,1993,1991,1989,1987,1986,1985,1983,1982,1981,1980,1979,1978,1977,1976,1975,1974,1973,1972,1971,1970,1969,1968,1967,1966,1965,1964,1963,1962,1961