33
/pt/
AIzaSyB4mHJ5NPEv-XzF7P6NDYXjlkCWaeKw5bc
November 1, 2025
158926
Iraq
IRQ
true
2
1
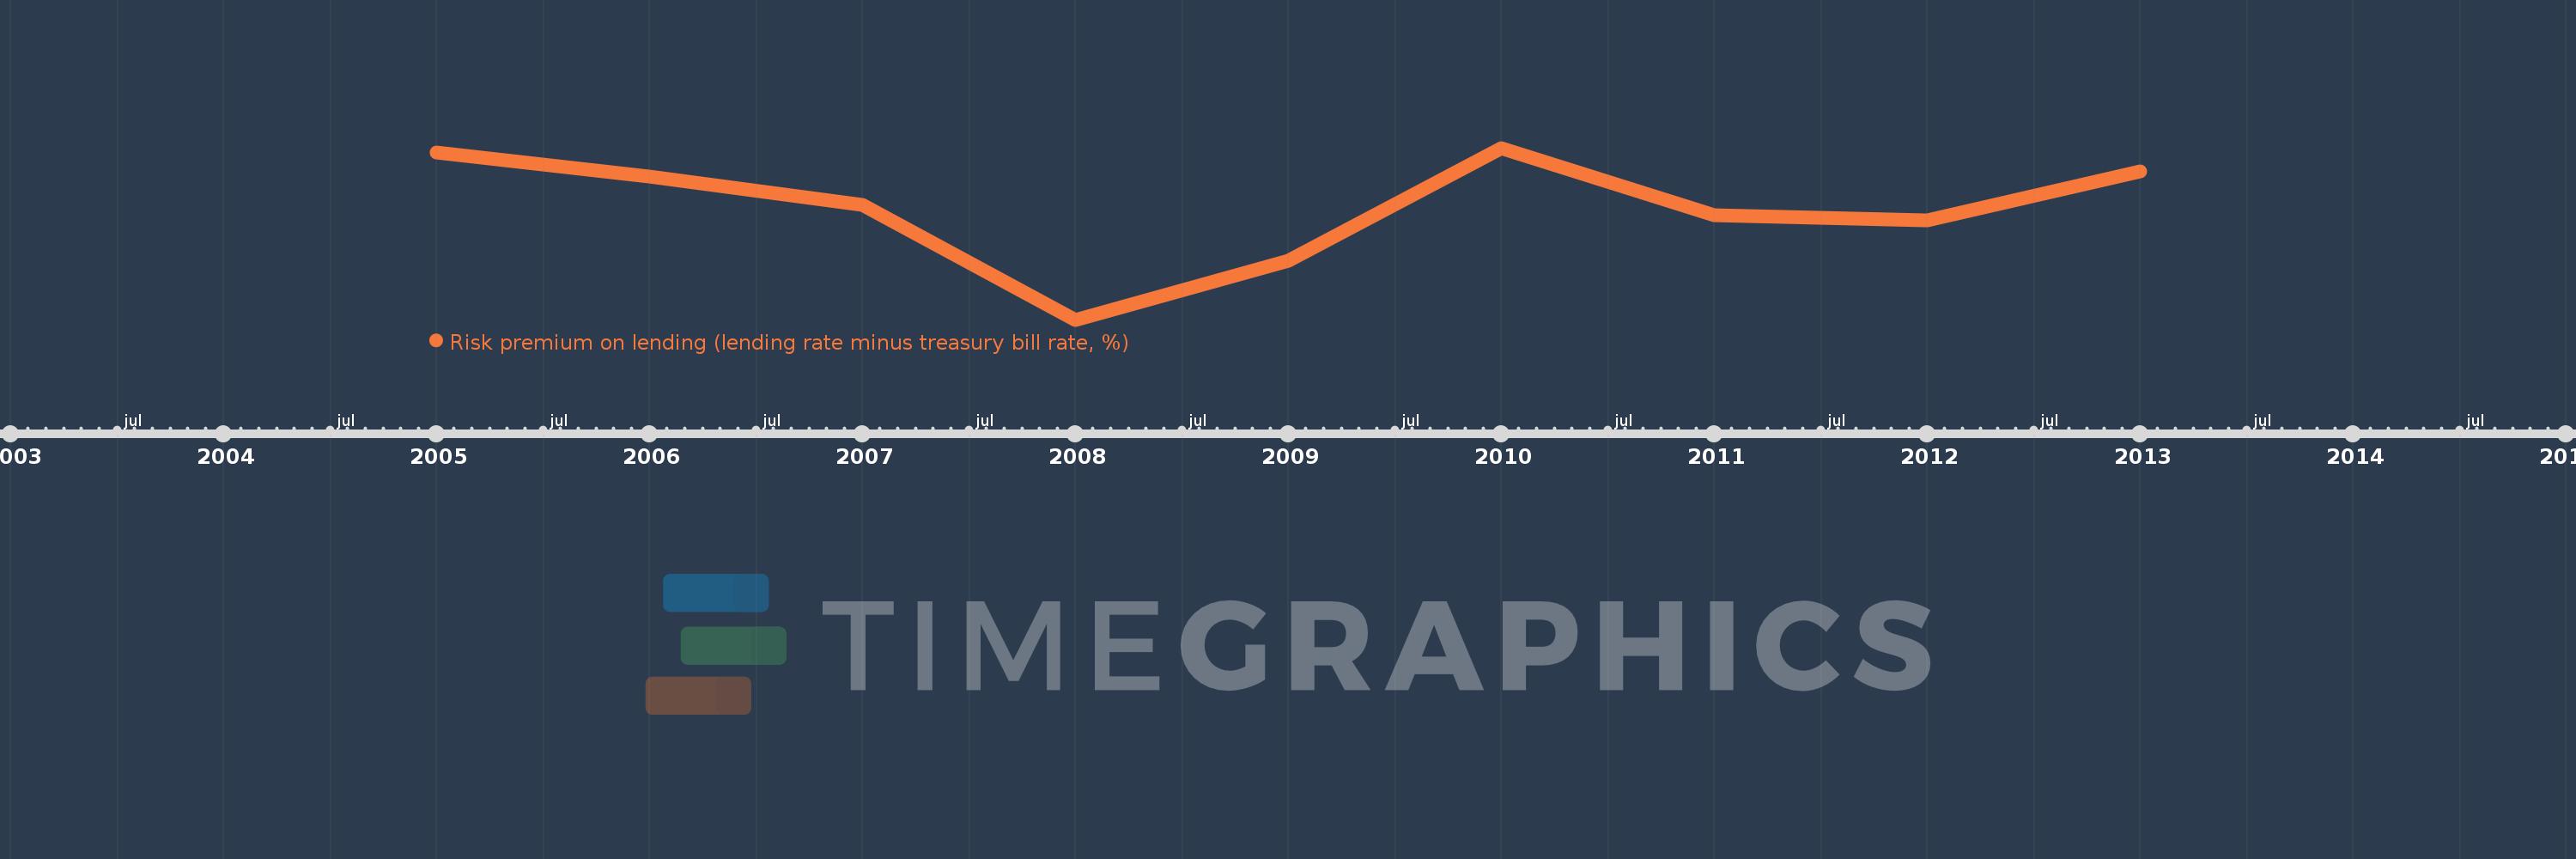
Risk premium on lending (lending rate minus treasury bill rate, %)
2013,2012,2011,2010,2009,2008,2007,2006,2005
Create a timeline
Public Timelines
For education
For educational institutions
For teachers
For students
Cabinet
For educational institutions
For teachers
For students
Open cabinet
FAQ
Receber premium
Close
Create a timeline
Public timelines
FAQ
About & Feedback
Acordo
Privacidade
FAQ
Support 24/7
Cabinet
Get premium
Donate
Download
Biblioteca de estatísticas globais
→
Iraq
→
Risk premium on lending (lending rate minus treasury bill rate, %)
Estas estatísticas em outros países:
Albania
Algeria
Angola
Antigua and Barbuda
Armenia
Australia
Azerbaijan
Bahamas, The
Bahrain
Bangladesh
Barbados
Belgium
Belize
Bolivia
Brazil
Bulgaria
Burundi
Cabo Verde
Canada
Cyprus
Czech Republic
Denmark
Dominica
Egypt, Arab Rep.
Ethiopia
Fiji
France
Gambia, The
Georgia
Germany
Ghana
Greece
Grenada
Guyana
Hong Kong SAR, China
Hungary
Iceland
Iraq
Ireland
Israel
Italy
Jamaica
Japan
Kenya
Kosovo
Kuwait
Kyrgyz Republic
Lao PDR
Latvia
Lebanon
Lesotho
Lithuania
Madagascar
Malawi
Malaysia
Maldives
Malta
Mauritania
Mauritius
Mexico
Moldova
Mongolia
Montenegro
Mozambique
Namibia
Nepal
Netherlands
New Zealand
Nigeria
Papua New Guinea
Philippines
Poland
Portugal
Romania
Russian Federation
Rwanda
Serbia
Seychelles
Sierra Leone
Singapore
Slovenia
Solomon Islands
South Africa
South Sudan
Spain
Sri Lanka
St. Kitts and Nevis
St. Lucia
St. Vincent and the Grenadines
Swaziland
Sweden
Switzerland
Tajikistan
Tanzania
Thailand
Trinidad and Tobago
Uganda
United Kingdom
United States
Uruguay
Vietnam
Yemen, Rep.
Zambia
Zimbabwe
Linha do tempo:
Nesta escala de tempo está apresentado um gráfico de
2005
ano até
2013
ano Iraq. Dados de
2004
ano ausente. O número de observações reais por data:
9
.
Fonte (nome):
Indicadores de desenvolvimento mundial
Fonte (organização):
International Monetary Fund, International Financial Statistics database.
Categorias:
Financial Sector
Foi atualizado:
23 abr 2017 ano
Indicadores de alterações dos valores ao longo dos anos
Em média:
4.824
Mínimo:
-1.533
1 jan 2008 ano
Máximo:
8.199
1 jan 2010 ano
Na data de observação
Valor
Mudança absoluta
A alteração em relação ao valor anterior
1 jan 2005 ano
7.959
+7.959
0.0%
1 jan 2006 ano
6.581
-1.378
-17.32%
1 jan 2007 ano
4.997
-1.583
-24.06%
1 jan 2008 ano
-1.533
-6.531
-130.68%
1 jan 2009 ano
1.824
+3.357
-218.97%
1 jan 2010 ano
8.199
+6.375
349.47%
1 jan 2011 ano
4.386
-3.813
-46.51%
1 jan 2012 ano
4.113
-0.272
-6.21%
1 jan 2013 ano
6.888
+2.775
67.46%
Classificação de países por estatísticas atuais por anos
About & Feedback
Acordo
Privacidade
FAQ
Support 24/7
Cabinet
Get premium
Donate
The service accepts bank transfer (ACH, Wire) or cards (Visa, MasterCard, etc). Processed by Stripe.
Secured with SSL