33
/pt/
AIzaSyB4mHJ5NPEv-XzF7P6NDYXjlkCWaeKw5bc
November 1, 2025
157864
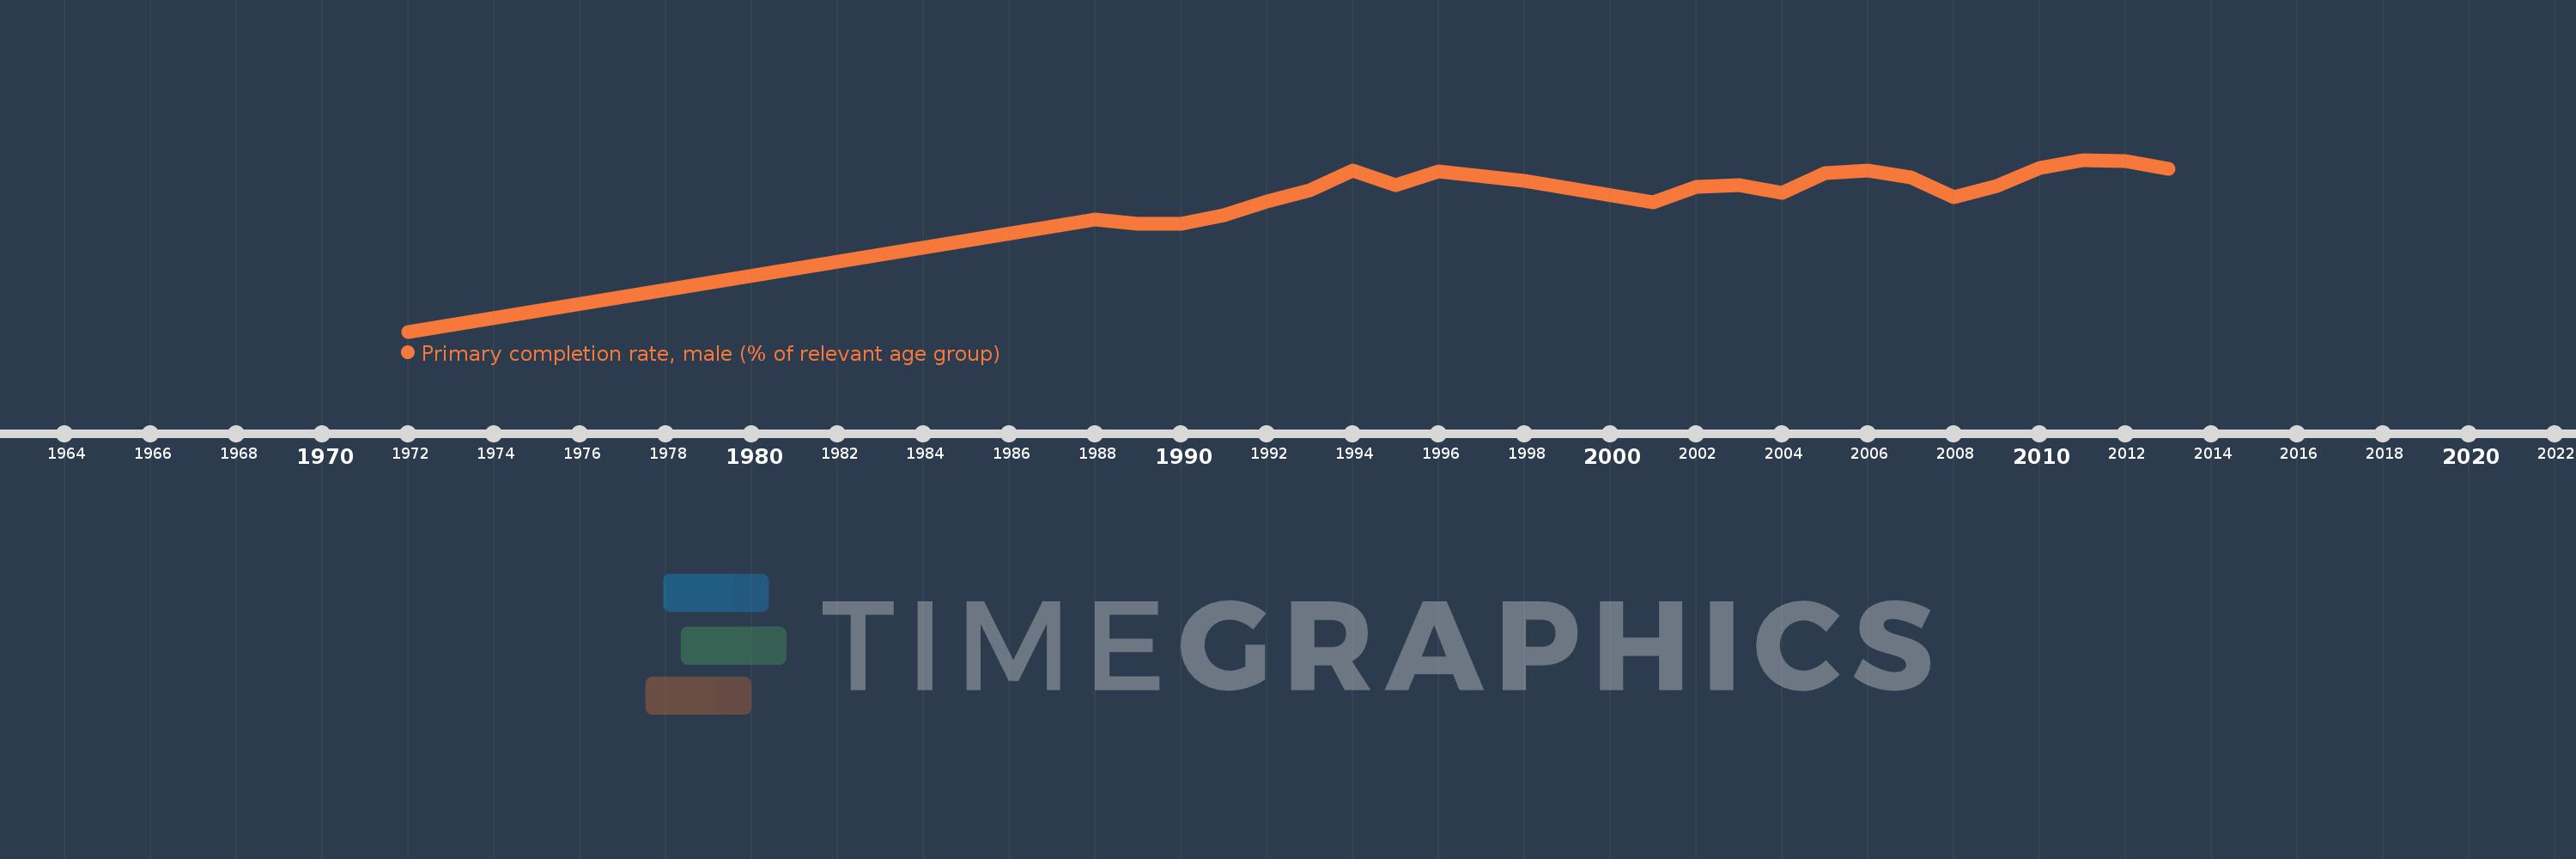
Iran, Islamic Rep.
IRN
true
2
1
Primary completion rate, male (% of relevant age group)
2013,2012,2011,2010,2009,2008,2007,2006,2005,2004,2003,2002,2001,1998,1996,1995,1994,1993,1992,1991,1990,1989,1988,1972