33
/pt/
AIzaSyB4mHJ5NPEv-XzF7P6NDYXjlkCWaeKw5bc
November 1, 2025
148586
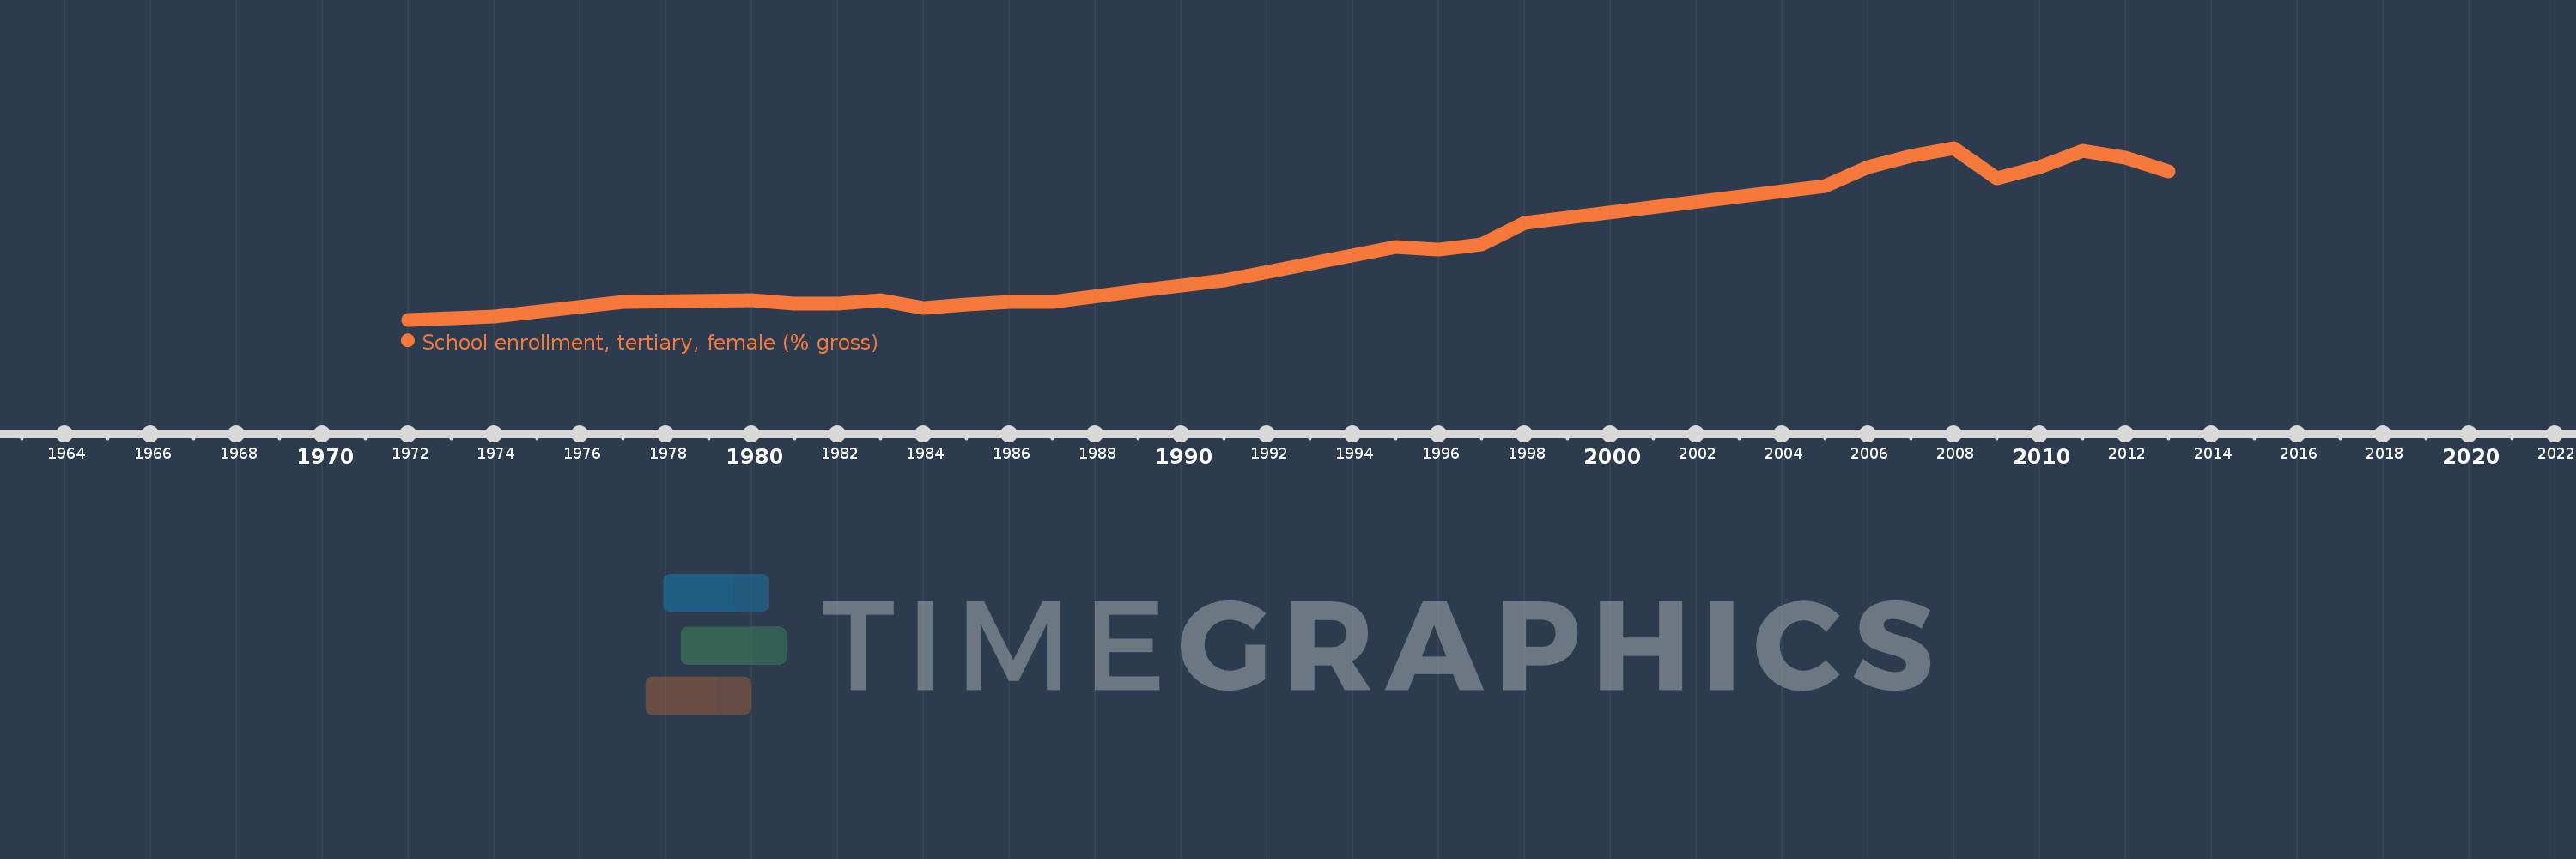
Guyana
GUY
true
2
1
School enrollment, tertiary, female (% gross)
2013,2012,2011,2010,2009,2008,2007,2006,2005,1998,1997,1996,1995,1991,1989,1987,1986,1985,1984,1983,1982,1981,1980,1977,1974,1973,1972