33
/pt/
AIzaSyB4mHJ5NPEv-XzF7P6NDYXjlkCWaeKw5bc
November 1, 2025
147424
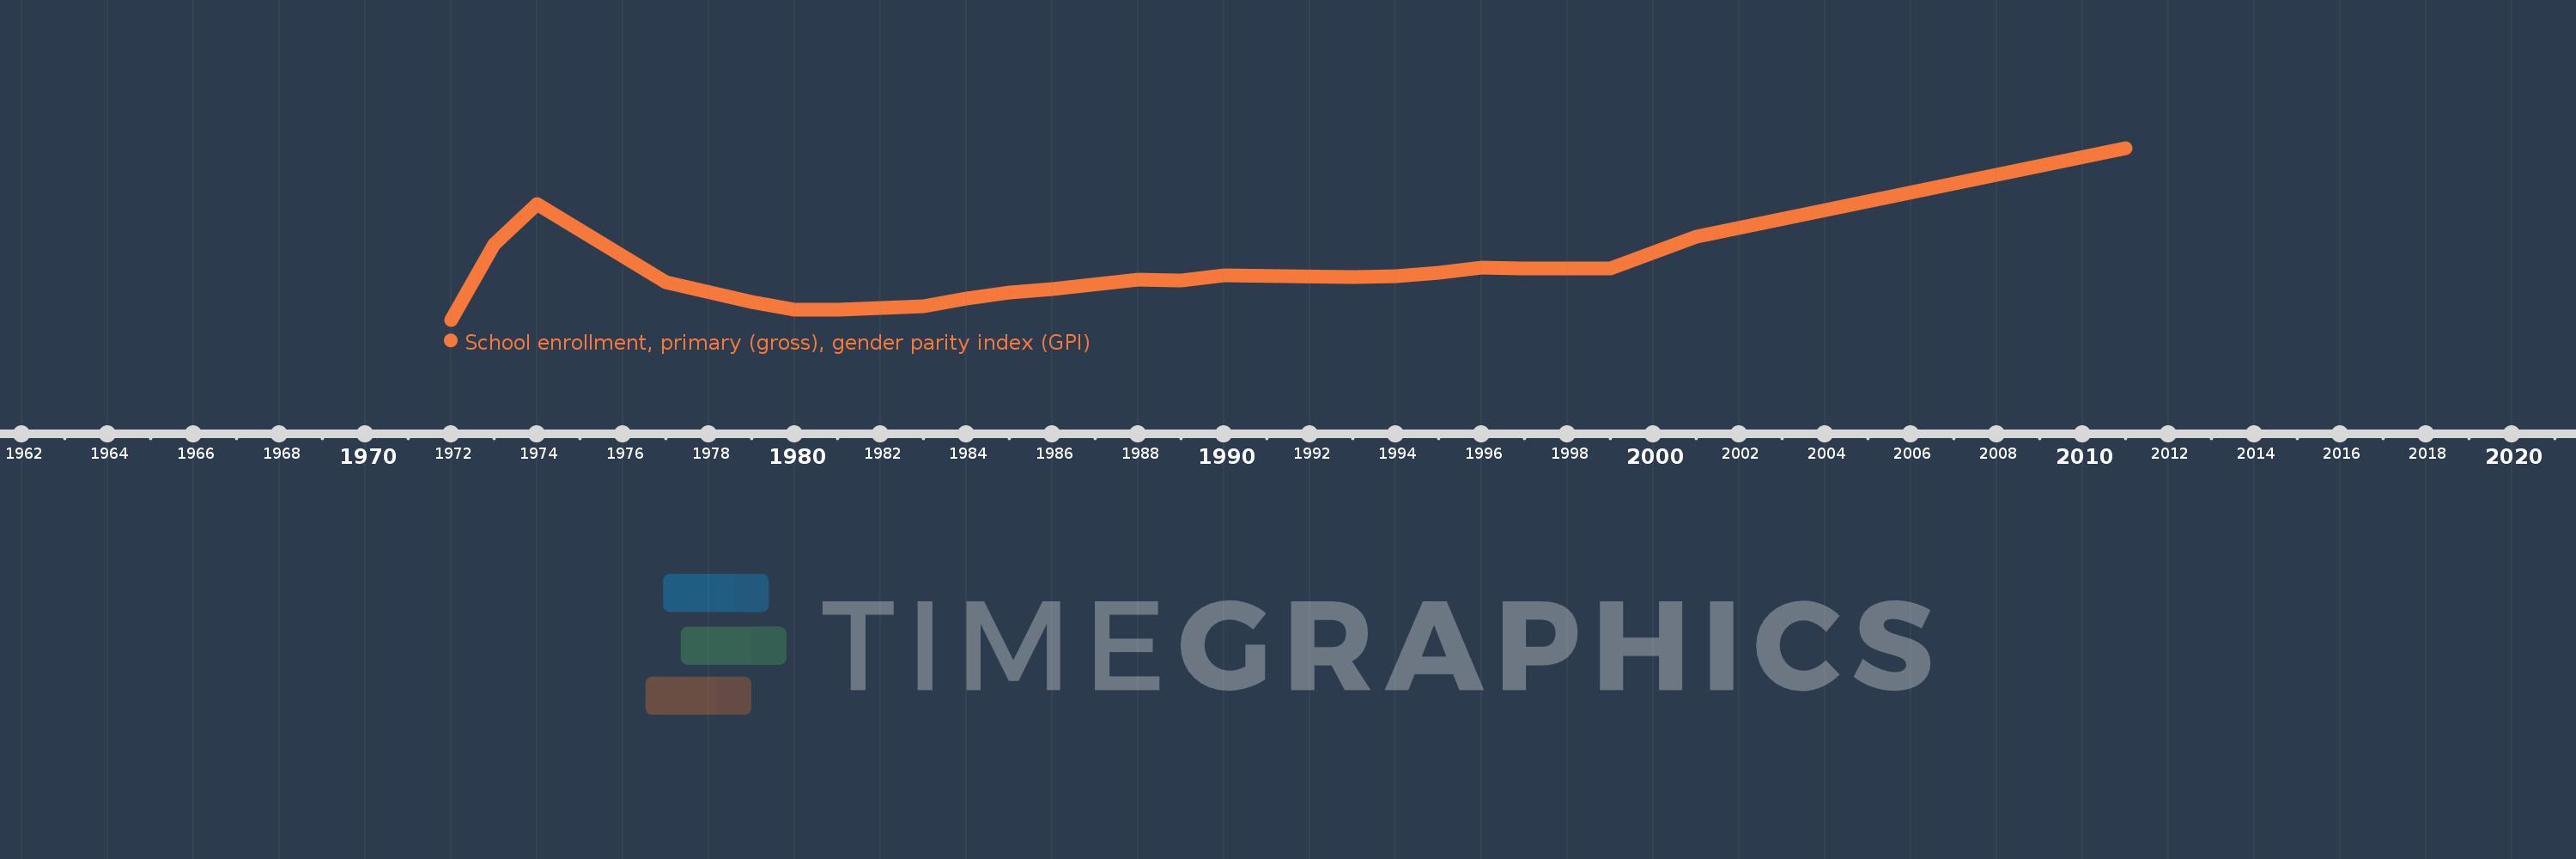
Guinea-Bissau
GNB
true
2
1
School enrollment, primary (gross), gender parity index (GPI)
2011,2001,1999,1998,1997,1996,1995,1994,1993,1990,1989,1988,1986,1985,1984,1983,1982,1981,1980,1979,1977,1974,1973,1972