30
/pt/
AIzaSyAYiBZKx7MnpbEhh9jyipgxe19OcubqV5w
April 1, 2024
145741
Guinea
GIN
true
2
1
Gross savings (% of GNI)
2014,2013,2012,2011,2010,2009,2008,2007,2006,2005,2004,2003,2002,2001,2000,1999,1998,1997,1996,1995,1994,1993,1992,1991,1990,1989,1988,1987
Download
Biblioteca de estatísticas globais →Guinea →

Gross savings (% of GNI)

Estas estatísticas em outros países:

AfghanistanAlbaniaAlgeriaAngolaAntigua and BarbudaArab WorldArgentinaArmeniaAustraliaAustriaAzerbaijanBahamas, TheBahrainBangladeshBarbadosBelarusBelgiumBelizeBeninBermudaBhutanBoliviaBosnia and HerzegovinaBotswanaBrazilBrunei DarussalamBulgariaBurkina FasoBurundiCabo VerdeCambodiaCameroonCanadaCaribbean small statesCentral African RepublicCentral Europe and the BalticsChadChileChinaColombiaComorosCongo, Dem. Rep.Congo, Rep.Costa RicaCote d'IvoireCroatiaCyprusCzech RepublicDenmarkDjiboutiDominicaDominican RepublicEarly-demographic dividendEast Asia & PacificEast Asia & Pacific (excluding high income)East Asia & Pacific (IDA & IBRD countries)EcuadorEgypt, Arab Rep.El SalvadorEquatorial GuineaEritreaEstoniaEthiopiaEuro areaEurope & Central AsiaEurope & Central Asia (excluding high income)Europe & Central Asia (IDA & IBRD countries)European UnionFaroe IslandsFijiFinlandFragile and conflict affected situationsFranceGabonGambia, TheGeorgiaGermanyGhanaGreeceGrenadaGuatemalaGuineaGuinea-BissauGuyanaHaitiHeavily indebted poor countries (HIPC)High incomeHondurasHong Kong SAR, ChinaHungaryIBRD onlyIcelandIDA & IBRD totalIDA blendIDA onlyIDA totalIndiaIndonesiaIran, Islamic Rep.IraqIrelandIsraelItalyJamaicaJapanJordanKazakhstanKenyaKiribatiKorea, Rep.KosovoKuwaitKyrgyz RepublicLao PDRLate-demographic dividendLatin America & Caribbean Latin America & Caribbean (excluding high income)Latin America & the Caribbean (IDA & IBRD countries)LatviaLeast developed countries: UN classificationLebanonLesothoLiberiaLibyaLithuaniaLow & middle incomeLow incomeLower middle incomeLuxembourgMacao SAR, ChinaMacedonia, FYRMadagascarMalawiMalaysiaMaldivesMaliMaltaMauritaniaMauritiusMexicoMiddle East & North AfricaMiddle East & North Africa (excluding high income)Middle East & North Africa (IDA & IBRD countries)Middle incomeMoldovaMongoliaMontenegroMoroccoMozambiqueNamibiaNepalNetherlandsNew ZealandNicaraguaNigerNigeriaNorth AmericaNorwayOECD membersOmanOther small statesPacific island small statesPakistanPanamaPapua New GuineaParaguayPeruPhilippinesPolandPortugalPost-demographic dividendPre-demographic dividendQatarRomaniaRussian FederationRwandaSaudi ArabiaSenegalSerbiaSeychellesSierra LeoneSingaporeSlovak RepublicSloveniaSmall statesSolomon IslandsSouth AfricaSouth AsiaSouth Asia (IDA & IBRD)South SudanSpainSri LankaSt. Kitts and NevisSt. LuciaSt. Vincent and the GrenadinesSub-Saharan Africa Sub-Saharan Africa (excluding high income)Sub-Saharan Africa (IDA & IBRD countries)SudanSurinameSwazilandSwedenSwitzerlandSyrian Arab RepublicTajikistanTanzaniaThailandTimor-LesteTogoTongaTrinidad and TobagoTunisiaTurkeyUgandaUkraineUnited KingdomUnited StatesUpper middle incomeUruguayVanuatuVenezuela, RBVietnamWest Bank and GazaWorldYemen, Rep.ZambiaZimbabwe

Linha do tempo:

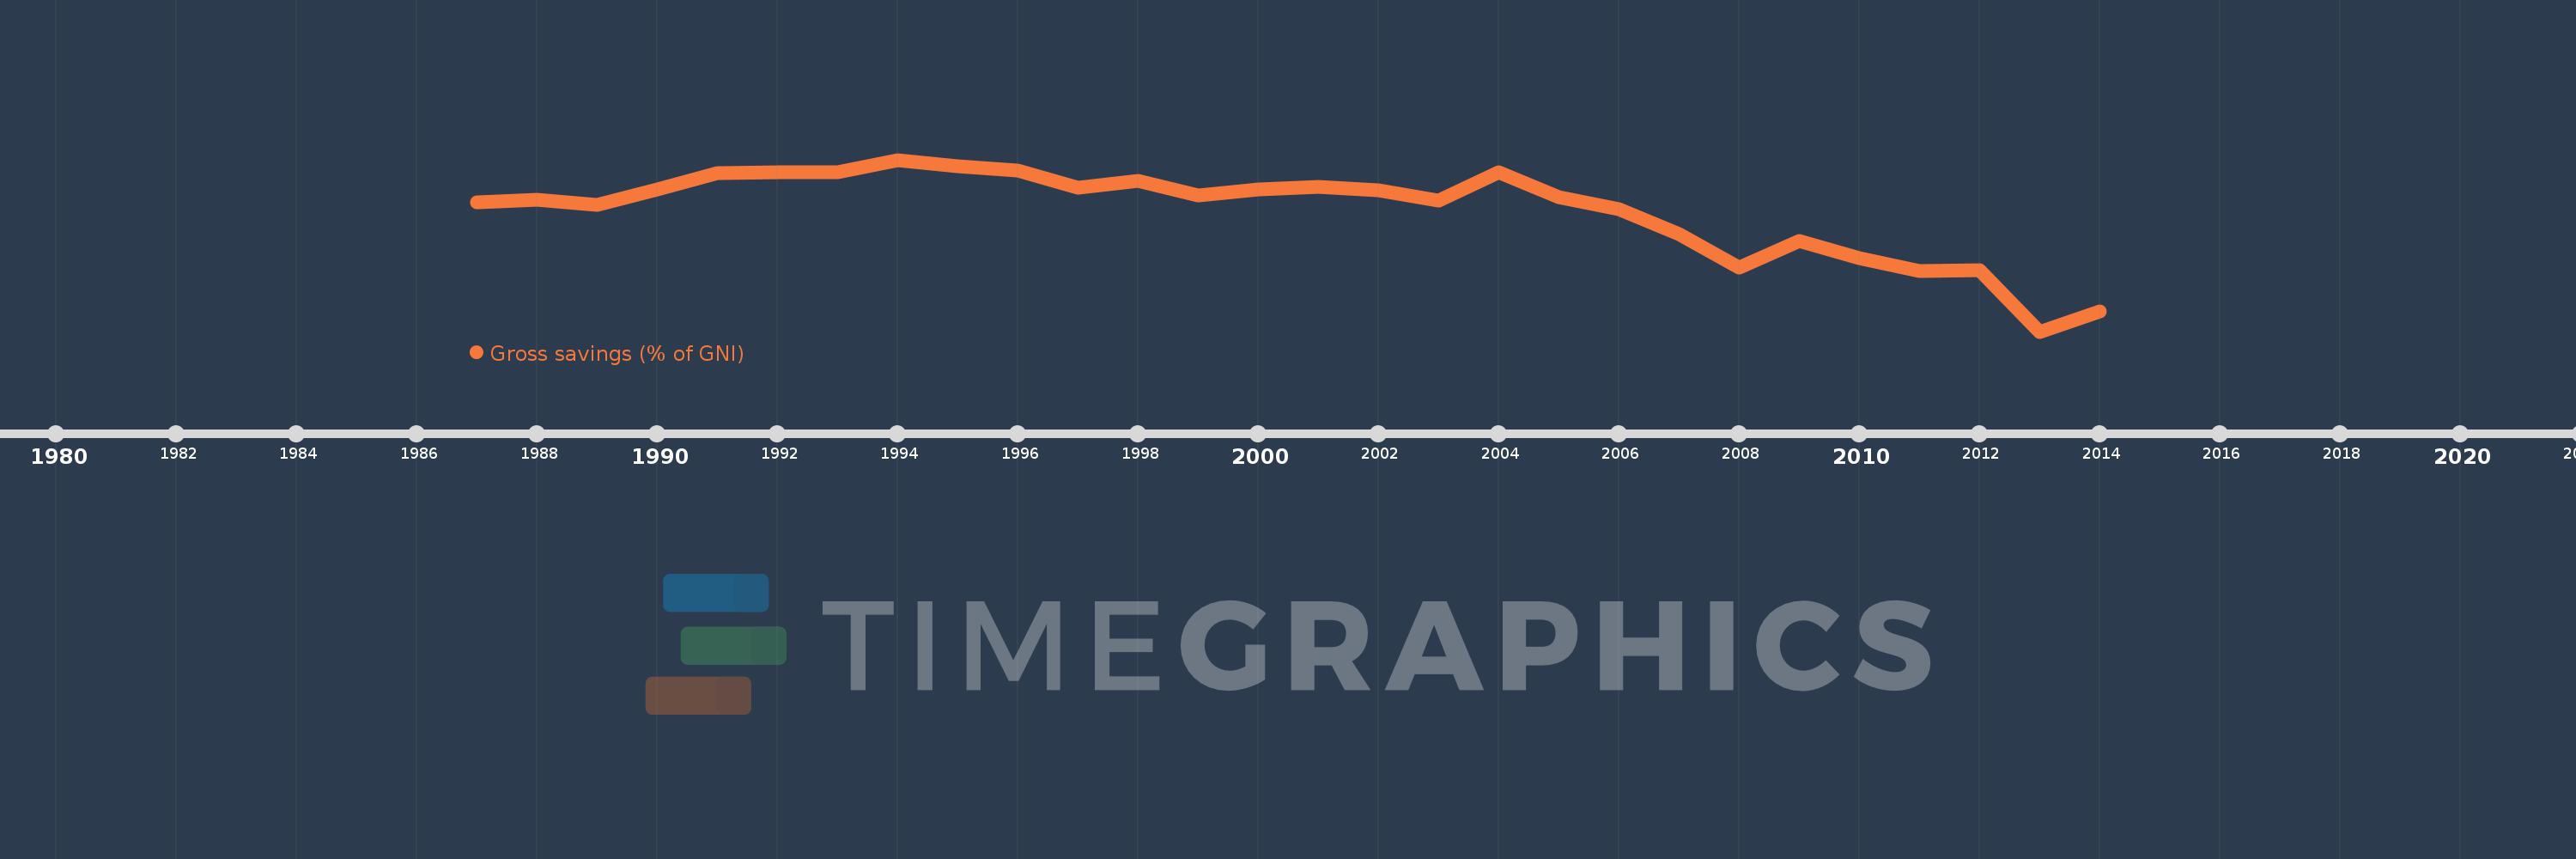
Nesta escala de tempo está apresentado um gráfico de 1987 ano até 2014 ano Guinea. Dados de 1986 ano ausente. O número de observações reais por data: 28.

Fonte (nome):

Indicadores de desenvolvimento mundial

Fonte (organização):

World Bank national accounts data, and OECD National Accounts data files.

Categorias:

Economy & Growth

Foi atualizado:

23 abr 2017 ano

Indicadores de alterações dos valores ao longo dos anos

Em média:
9.835
Mínimo:
-23.935
1 jan 2013 ano
Máximo:
24.185
1 jan 1994 ano
Na data de observação
Valor
Mudança absoluta
A alteração em relação ao valor anterior
1 jan 1987 ano
12.37
+12.37
0.0%
1 jan 1988 ano
12.965
+0.595
4.81%
1 jan 1989 ano
11.657
-1.309
-10.09%
1 jan 1990 ano
16.004
+4.347
37.29%
1 jan 1991 ano
20.346
+4.342
27.13%
1 jan 1992 ano
20.682
+0.336
1.65%
1 jan 1993 ano
20.642
-0.04
-0.19%
1 jan 1994 ano
24.185
+3.542
17.16%
1 jan 1995 ano
22.354
-1.831
-7.57%
1 jan 1996 ano
21.111
-1.243
-5.56%
1 jan 1997 ano
16.359
-4.751
-22.51%
1 jan 1998 ano
18.384
+2.025
12.38%
1 jan 1999 ano
14.08
-4.304
-23.41%
1 jan 2000 ano
15.797
+1.717
12.19%
1 jan 2001 ano
16.512
+0.715
4.53%
1 jan 2002 ano
15.61
-0.902
-5.46%
1 jan 2003 ano
12.637
-2.973
-19.05%
1 jan 2004 ano
20.657
+8.019
63.46%
1 jan 2005 ano
13.631
-7.025
-34.01%
1 jan 2006 ano
10.346
-3.286
-24.1%
1 jan 2007 ano
3.354
-6.992
-67.58%
1 jan 2008 ano
-6.074
-9.428
-281.13%
1 jan 2009 ano
1.351
+7.426
-122.25%
1 jan 2010 ano
-3.346
-4.697
-347.58%
1 jan 2011 ano
-7.054
-3.708
110.83%
1 jan 2012 ano
-6.847
+0.207
-2.94%
1 jan 2013 ano
-23.935
-17.088
249.58%
1 jan 2014 ano
-18.394
+5.54
-23.15%

Classificação de países por estatísticas atuais por anos