33
/pt/
AIzaSyB4mHJ5NPEv-XzF7P6NDYXjlkCWaeKw5bc
November 30, 2025
135930
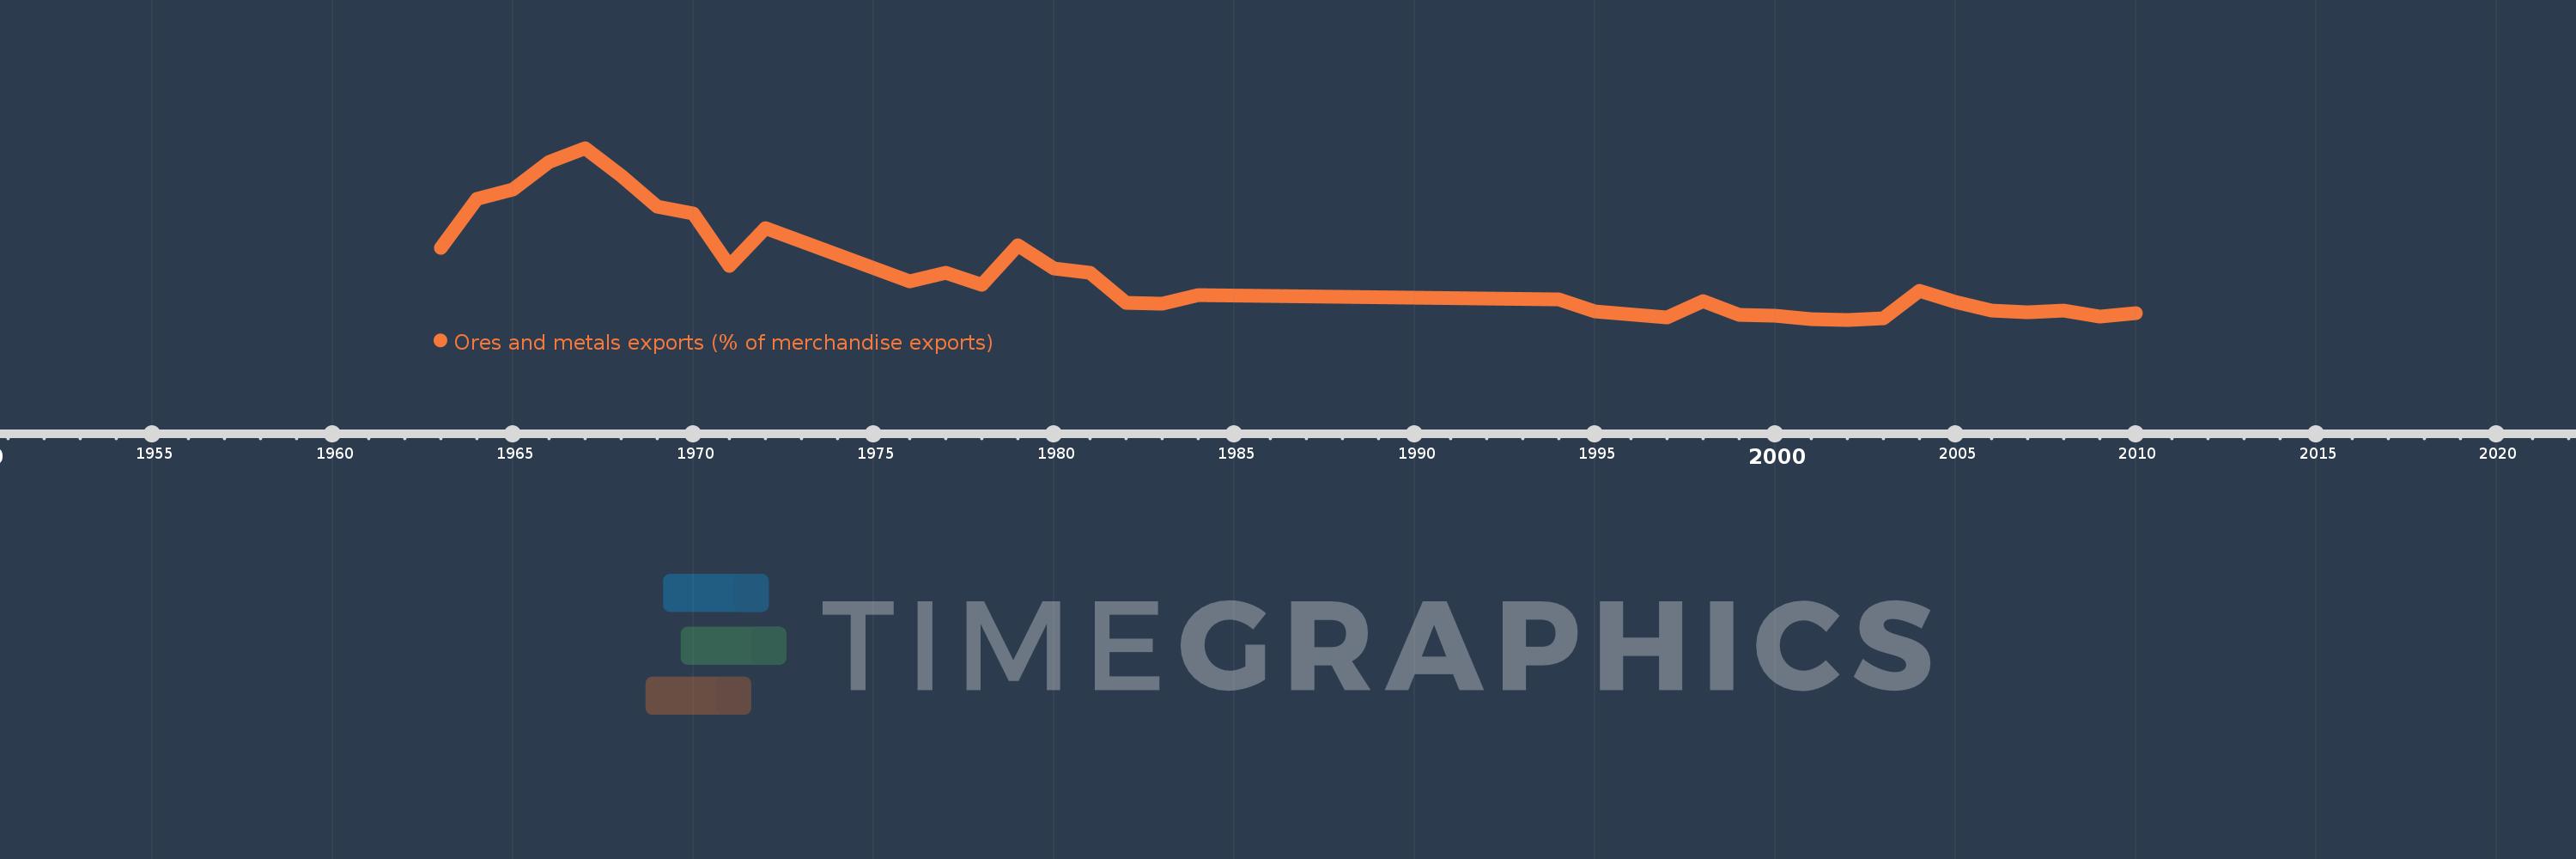
Gabon
GAB
true
2
1
Ores and metals exports (% of merchandise exports)
2010,2009,2008,2007,2006,2005,2004,2003,2002,2001,2000,1999,1998,1997,1995,1994,1984,1983,1982,1981,1980,1979,1978,1977,1976,1972,1971,1970,1969,1968,1967,1966,1965,1964,1963