33
/pt/
AIzaSyAYiBZKx7MnpbEhh9jyipgxe19OcubqV5w
May 1, 2025
128618
Eritrea
ERI
true
2
1
Net ODA received (% of gross capital formation)
2012,2011,2010,2009,2008,2007,2006,2005,2004,2003,2002,2001,2000,1999,1998,1997,1996,1995,1994,1993
Download
Biblioteca de estatísticas globais →Eritrea →

Net ODA received (% of gross capital formation)

Estas estatísticas em outros países:

AfghanistanAlbaniaAlgeriaAngolaAntigua and BarbudaArab WorldArgentinaArmeniaArubaAzerbaijanBahamas, TheBahrainBangladeshBarbadosBelarusBelizeBeninBhutanBoliviaBosnia and HerzegovinaBotswanaBrazilBrunei DarussalamBurkina FasoBurundiCabo VerdeCambodiaCameroonCaribbean small statesCentral African RepublicCentral Europe and the BalticsChadChileChinaColombiaComorosCongo, Dem. Rep.Congo, Rep.Costa RicaCote d'IvoireCroatiaCubaCyprusDjiboutiDominicaDominican RepublicEast Asia & PacificEast Asia & Pacific (excluding high income)East Asia & Pacific (IDA & IBRD countries)EcuadorEgypt, Arab Rep.El SalvadorEquatorial GuineaEritreaEthiopiaEuro areaEurope & Central AsiaEurope & Central Asia (excluding high income)Europe & Central Asia (IDA & IBRD countries)European UnionFijiFragile and conflict affected situationsGabonGambia, TheGeorgiaGhanaGrenadaGuatemalaGuineaGuinea-BissauGuyanaHaitiHeavily indebted poor countries (HIPC)High incomeHondurasHong Kong SAR, ChinaIBRD onlyIDA & IBRD totalIDA blendIDA onlyIDA totalIndiaIndonesiaIran, Islamic Rep.IraqIsraelJamaicaJordanKazakhstanKenyaKiribatiKorea, Rep.KosovoKuwaitKyrgyz RepublicLao PDRLatin America & Caribbean Latin America & Caribbean (excluding high income)Latin America & the Caribbean (IDA & IBRD countries)Least developed countries: UN classificationLebanonLesothoLiberiaLibyaLow & middle incomeLow incomeLower middle incomeMacao SAR, ChinaMacedonia, FYRMadagascarMalawiMalaysiaMaldivesMaliMaltaMauritaniaMauritiusMexicoMiddle East & North AfricaMiddle East & North Africa (excluding high income)Middle East & North Africa (IDA & IBRD countries)Middle incomeMoldovaMongoliaMontenegroMoroccoMozambiqueNamibiaNepalNew CaledoniaNicaraguaNigerNigeriaNorth AmericaOECD membersOmanOther small statesPakistanPanamaPapua New GuineaParaguayPeruPhilippinesQatarRwandaSaudi ArabiaSenegalSerbiaSeychellesSierra LeoneSingaporeSloveniaSmall statesSolomon IslandsSouth AfricaSouth AsiaSouth Asia (IDA & IBRD)South SudanSri LankaSt. Kitts and NevisSt. LuciaSt. Vincent and the GrenadinesSub-Saharan Africa Sub-Saharan Africa (excluding high income)Sub-Saharan Africa (IDA & IBRD countries)SudanSurinameSwazilandSyrian Arab RepublicTajikistanTanzaniaThailandTimor-LesteTogoTongaTrinidad and TobagoTunisiaTurkeyTurkmenistanUgandaUkraineUpper middle incomeUruguayUzbekistanVanuatuVenezuela, RBVietnamWest Bank and GazaWorldYemen, Rep.ZambiaZimbabwe

Linha do tempo:

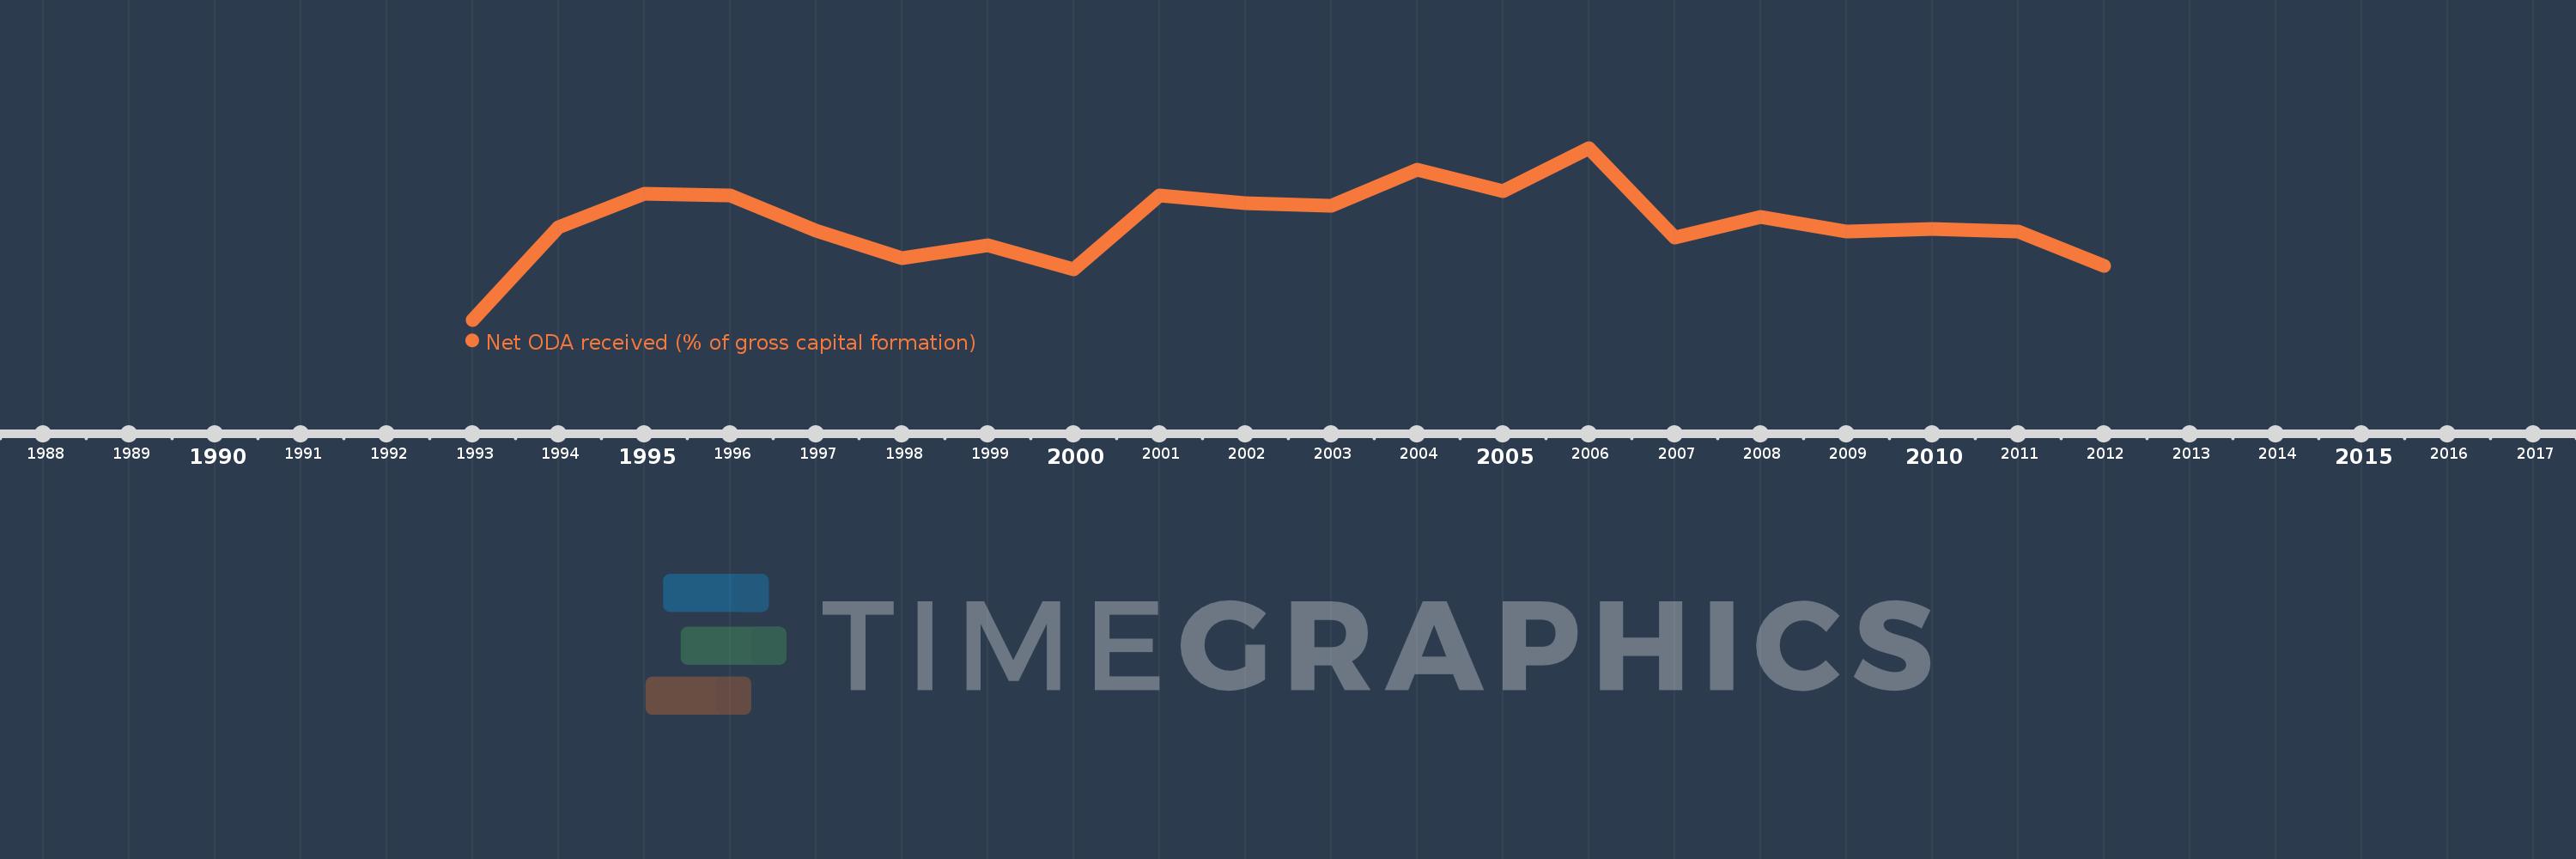
Nesta escala de tempo está apresentado um gráfico de 1993 ano até 2012 ano Eritrea. Dados de 1992 ano ausente. O número de observações reais por data: 20.

Fonte (nome):

Indicadores de desenvolvimento mundial

Fonte (organização):

Development Assistance Committee of the Organisation for Economic Co-operation and Development, Geographical Distribution of Financial Flows to Developing Countries, Development Co-operation Report, and International Development Statistics database. Data are available online at: www.oecd.org/dac/stats/idsonline. World Bank gross capital formation estimates are used for the denominator.

Categorias:

Aid Effectiveness

Foi atualizado:

23 abr 2017 ano

Indicadores de alterações dos valores ao longo dos anos

Em média:
88.966
Mínimo:
2.683
1 jan 1993 ano
Máximo:
156.311
1 jan 2006 ano
Na data de observação
Valor
Mudança absoluta
A alteração em relação ao valor anterior
1 jan 1993 ano
2.683
+2.683
0.0%
1 jan 1994 ano
85.154
+82.47
3.07 mil%
1 jan 1995 ano
115.336
+30.183
35.44%
1 jan 1996 ano
113.837
-1.5
-1.3%
1 jan 1997 ano
82.308
-31.528
-27.7%
1 jan 1998 ano
57.428
-24.881
-30.23%
1 jan 1999 ano
69.508
+12.08
21.03%
1 jan 2000 ano
47.417
-22.091
-31.78%
1 jan 2001 ano
113.928
+66.511
140.27%
1 jan 2002 ano
106.94
-6.988
-6.13%
1 jan 2003 ano
104.772
-2.168
-2.03%
1 jan 2004 ano
137.218
+32.446
30.97%
1 jan 2005 ano
117.876
-19.341
-14.1%
1 jan 2006 ano
156.311
+38.434
32.61%
1 jan 2007 ano
75.92
-80.391
-51.43%
1 jan 2008 ano
94.813
+18.893
24.88%
1 jan 2009 ano
81.769
-13.044
-13.76%
1 jan 2010 ano
83.54
+1.772
2.17%
1 jan 2011 ano
81.572
-1.968
-2.36%
1 jan 2012 ano
50.995
-30.578
-37.49%

Classificação de países por estatísticas atuais por anos