33
/pt/
AIzaSyB4mHJ5NPEv-XzF7P6NDYXjlkCWaeKw5bc
November 1, 2025
126949
El Salvador
SLV
true
2
1
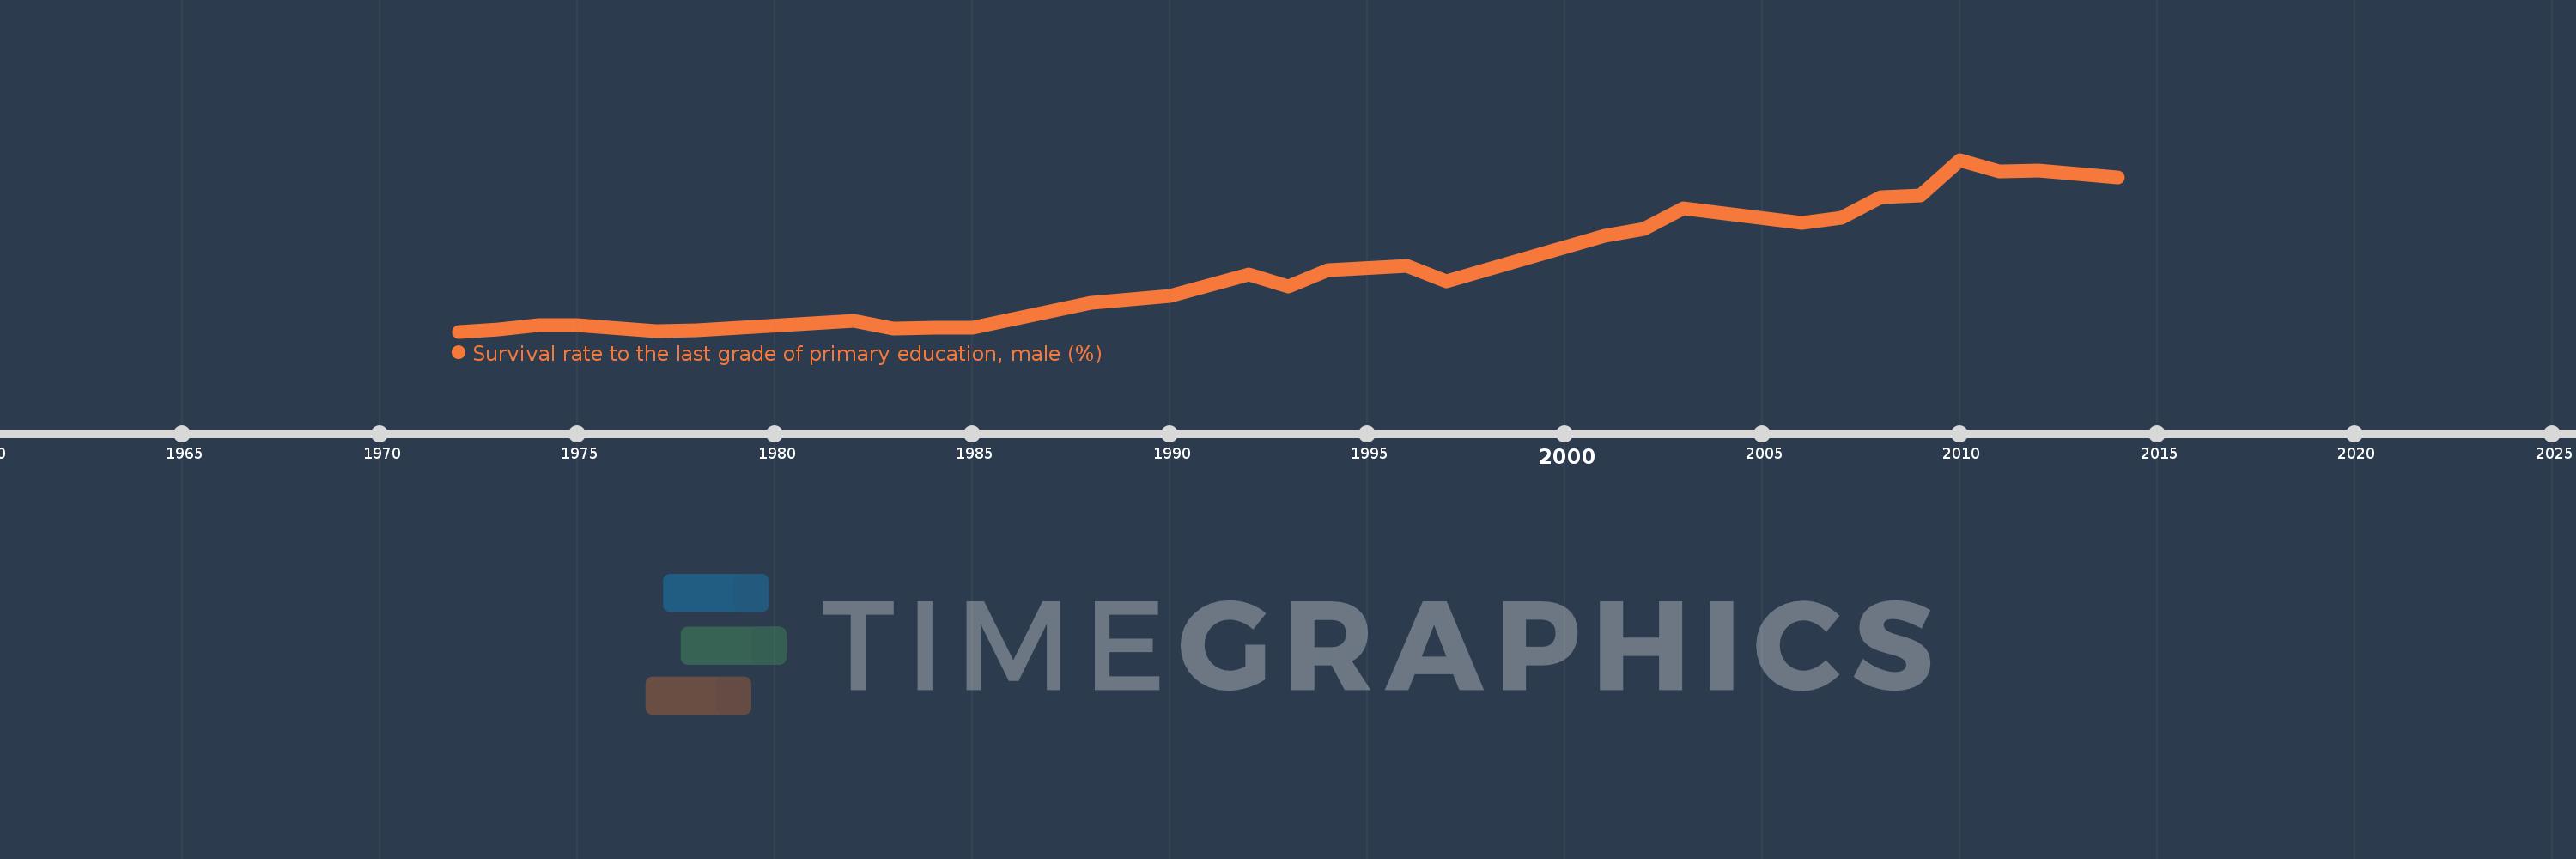
Survival rate to the last grade of primary education, male (%)
2014,2013,2012,2011,2010,2009,2008,2007,2006,2003,2002,2001,1997,1996,1994,1993,1992,1990,1989,1988,1985,1984,1983,1982,1978,1977,1975,1974,1973,1972