30
/pt/
AIzaSyAYiBZKx7MnpbEhh9jyipgxe19OcubqV5w
April 1, 2024
124651
Egypt, Arab Rep.
EGY
true
2
1
Depositors with commercial banks (per 1,000 adults)
2016,2015,2014,2013,2012
Download
Biblioteca de estatísticas globais →Egypt, Arab Rep. →

Depositors with commercial banks (per 1,000 adults)

Estas estatísticas em outros países:

AfghanistanAngolaArab WorldArgentinaAzerbaijanBangladeshBelizeBeninBotswanaBrazilBrunei DarussalamBurkina FasoBurundiCabo VerdeCameroonCentral African RepublicChadChinaColombiaComorosCongo, Dem. Rep.Congo, Rep.Costa RicaCote d'IvoireCroatiaDjiboutiDominican RepublicEarly-demographic dividendEast Asia & Pacific (excluding high income)East Asia & Pacific (IDA & IBRD countries)EcuadorEgypt, Arab Rep.Equatorial GuineaEstoniaEthiopiaFragile and conflict affected situationsGabonGeorgiaGhanaGuineaGuinea-BissauHaitiHeavily indebted poor countries (HIPC)HungaryIBRD onlyIDA & IBRD totalIDA blendIDA onlyIDA totalIsraelItalyKenyaKiribatiKuwaitKyrgyz RepublicLao PDRLatin America & Caribbean (excluding high income)Latin America & the Caribbean (IDA & IBRD countries)LatviaLeast developed countries: UN classificationLebanonLesothoLibyaLow & middle incomeLow incomeLower middle incomeMadagascarMalawiMalaysiaMaldivesMaliMaltaMauritaniaMiddle East & North AfricaMiddle East & North Africa (excluding high income)Middle East & North Africa (IDA & IBRD countries)Middle incomeMoldovaMyanmarNamibiaNigerNigeriaNorwayOther small statesPakistanPalauParaguayPeruPhilippinesPolandPre-demographic dividendQatarRwandaSamoaSan MarinoSao Tome and PrincipeSaudi ArabiaSenegalSeychellesSierra LeoneSingaporeSmall statesSolomon IslandsSouth AsiaSouth Asia (IDA & IBRD)South SudanSub-Saharan Africa Sub-Saharan Africa (excluding high income)Sub-Saharan Africa (IDA & IBRD countries)SurinameSwazilandSyrian Arab RepublicTajikistanTanzaniaThailandTimor-LesteTogoTunisiaTurkeyUgandaUkraineUpper middle incomeUruguayUzbekistanVanuatuVenezuela, RBWest Bank and GazaWorldYemen, Rep.ZambiaZimbabwe

Linha do tempo:

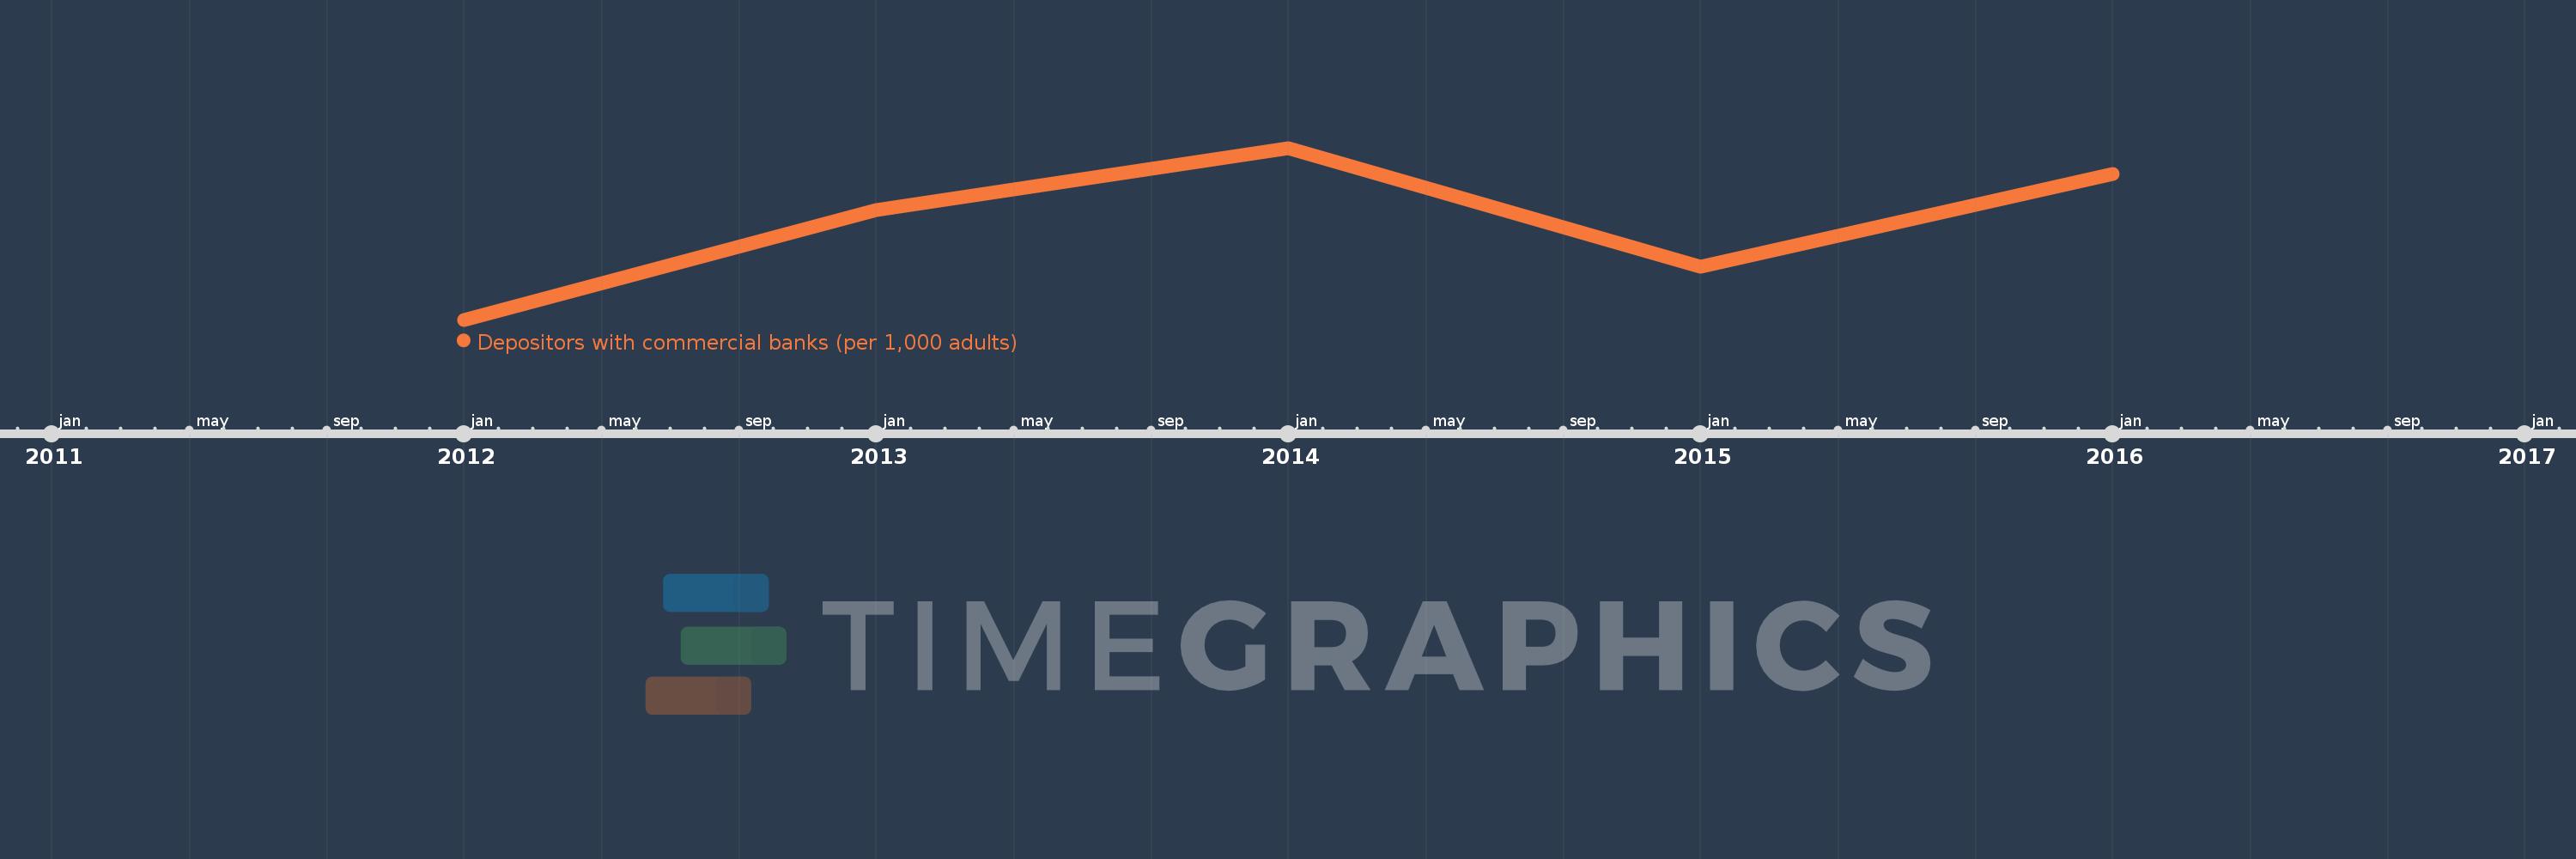
Nesta escala de tempo está apresentado um gráfico de 2012 ano até 2016 ano Egypt, Arab Rep.. Dados de 2011 ano ausente. O número de observações reais por data: 5.

Fonte (nome):

Indicadores de desenvolvimento mundial

Fonte (organização):

International Monetary Fund, Financial Access Survey.

Categorias:

Financial Sector

Foi atualizado:

23 abr 2017 ano

Indicadores de alterações dos valores ao longo dos anos

Em média:
363.471
Mínimo:
351.906
1 jan 2012 ano
Máximo:
372.568
1 jan 2014 ano
Na data de observação
Valor
Mudança absoluta
A alteração em relação ao valor anterior
1 jan 2012 ano
351.906
+351.906
0.0%
1 jan 2013 ano
365.132
+13.227
3.76%
1 jan 2014 ano
372.568
+7.435
2.04%
1 jan 2015 ano
358.264
-14.303
-3.84%
1 jan 2016 ano
369.487
+11.223
3.13%

Classificação de países por estatísticas atuais por anos