33
/pt/
AIzaSyAYiBZKx7MnpbEhh9jyipgxe19OcubqV5w
August 1, 2025
117888
Czech Republic
CZE
true
2
1
Forest rents (% of GDP)
2014,2013,2012,2011,2010,2009,2008,2007,2006,2005,2004,2003,2002,2001,2000,1999,1998,1997,1996,1995,1994
Download
Biblioteca de estatísticas globais →Czech Republic →

Forest rents (% of GDP)

Estas estatísticas em outros países:

AfghanistanAlbaniaAlgeriaAndorraAngolaArab WorldArgentinaArmeniaArubaAustraliaAustriaAzerbaijanBahamas, TheBahrainBangladeshBarbadosBelarusBelgiumBelizeBeninBhutanBoliviaBosnia and HerzegovinaBotswanaBrazilBrunei DarussalamBulgariaBurkina FasoBurundiCabo VerdeCambodiaCameroonCanadaCaribbean small statesCentral African RepublicCentral Europe and the BalticsChadChileChinaColombiaComorosCongo, Dem. Rep.Congo, Rep.Costa RicaCote d'IvoireCroatiaCubaCyprusCzech RepublicDenmarkDjiboutiDominicaDominican RepublicEarly-demographic dividendEast Asia & PacificEast Asia & Pacific (excluding high income)East Asia & Pacific (IDA & IBRD countries)EcuadorEgypt, Arab Rep.El SalvadorEquatorial GuineaEritreaEstoniaEthiopiaEuro areaEurope & Central AsiaEurope & Central Asia (excluding high income)Europe & Central Asia (IDA & IBRD countries)European UnionFaroe IslandsFijiFinlandFragile and conflict affected situationsFranceFrench PolynesiaGabonGambia, TheGeorgiaGermanyGhanaGreeceGuatemalaGuineaGuinea-BissauGuyanaHaitiHeavily indebted poor countries (HIPC)High incomeHondurasHong Kong SAR, ChinaHungaryIBRD onlyIcelandIDA & IBRD totalIDA blendIDA onlyIDA totalIndiaIndonesiaIran, Islamic Rep.IraqIrelandIsraelItalyJamaicaJapanJordanKazakhstanKenyaKiribatiKorea, Rep.KuwaitKyrgyz RepublicLao PDRLate-demographic dividendLatin America & Caribbean Latin America & Caribbean (excluding high income)Latin America & the Caribbean (IDA & IBRD countries)LatviaLeast developed countries: UN classificationLebanonLesothoLiberiaLibyaLiechtensteinLithuaniaLow & middle incomeLow incomeLower middle incomeLuxembourgMacao SAR, ChinaMacedonia, FYRMadagascarMalawiMalaysiaMaldivesMaliMaltaMauritaniaMauritiusMexicoMicronesia, Fed. Sts.Middle East & North AfricaMiddle East & North Africa (excluding high income)Middle East & North Africa (IDA & IBRD countries)Middle incomeMoldovaMongoliaMontenegroMoroccoMozambiqueMyanmarNamibiaNepalNetherlandsNew CaledoniaNew ZealandNicaraguaNigerNigeriaNorth AmericaNorwayOECD membersOmanOther small statesPacific island small statesPakistanPanamaPapua New GuineaParaguayPeruPhilippinesPolandPortugalPost-demographic dividendPre-demographic dividendQatarRomaniaRussian FederationRwandaSamoaSao Tome and PrincipeSaudi ArabiaSenegalSerbiaSeychellesSierra LeoneSingaporeSlovak RepublicSloveniaSmall statesSolomon IslandsSomaliaSouth AfricaSouth AsiaSouth Asia (IDA & IBRD)South SudanSpainSri LankaSt. LuciaSt. Vincent and the GrenadinesSub-Saharan Africa Sub-Saharan Africa (excluding high income)Sub-Saharan Africa (IDA & IBRD countries)SudanSurinameSwazilandSwedenSwitzerlandSyrian Arab RepublicTajikistanTanzaniaThailandTimor-LesteTogoTongaTrinidad and TobagoTunisiaTurkeyTurkmenistanUgandaUkraineUnited Arab EmiratesUnited KingdomUnited StatesUpper middle incomeUruguayUzbekistanVanuatuVenezuela, RBVietnamWorldYemen, Rep.ZambiaZimbabwe

Linha do tempo:

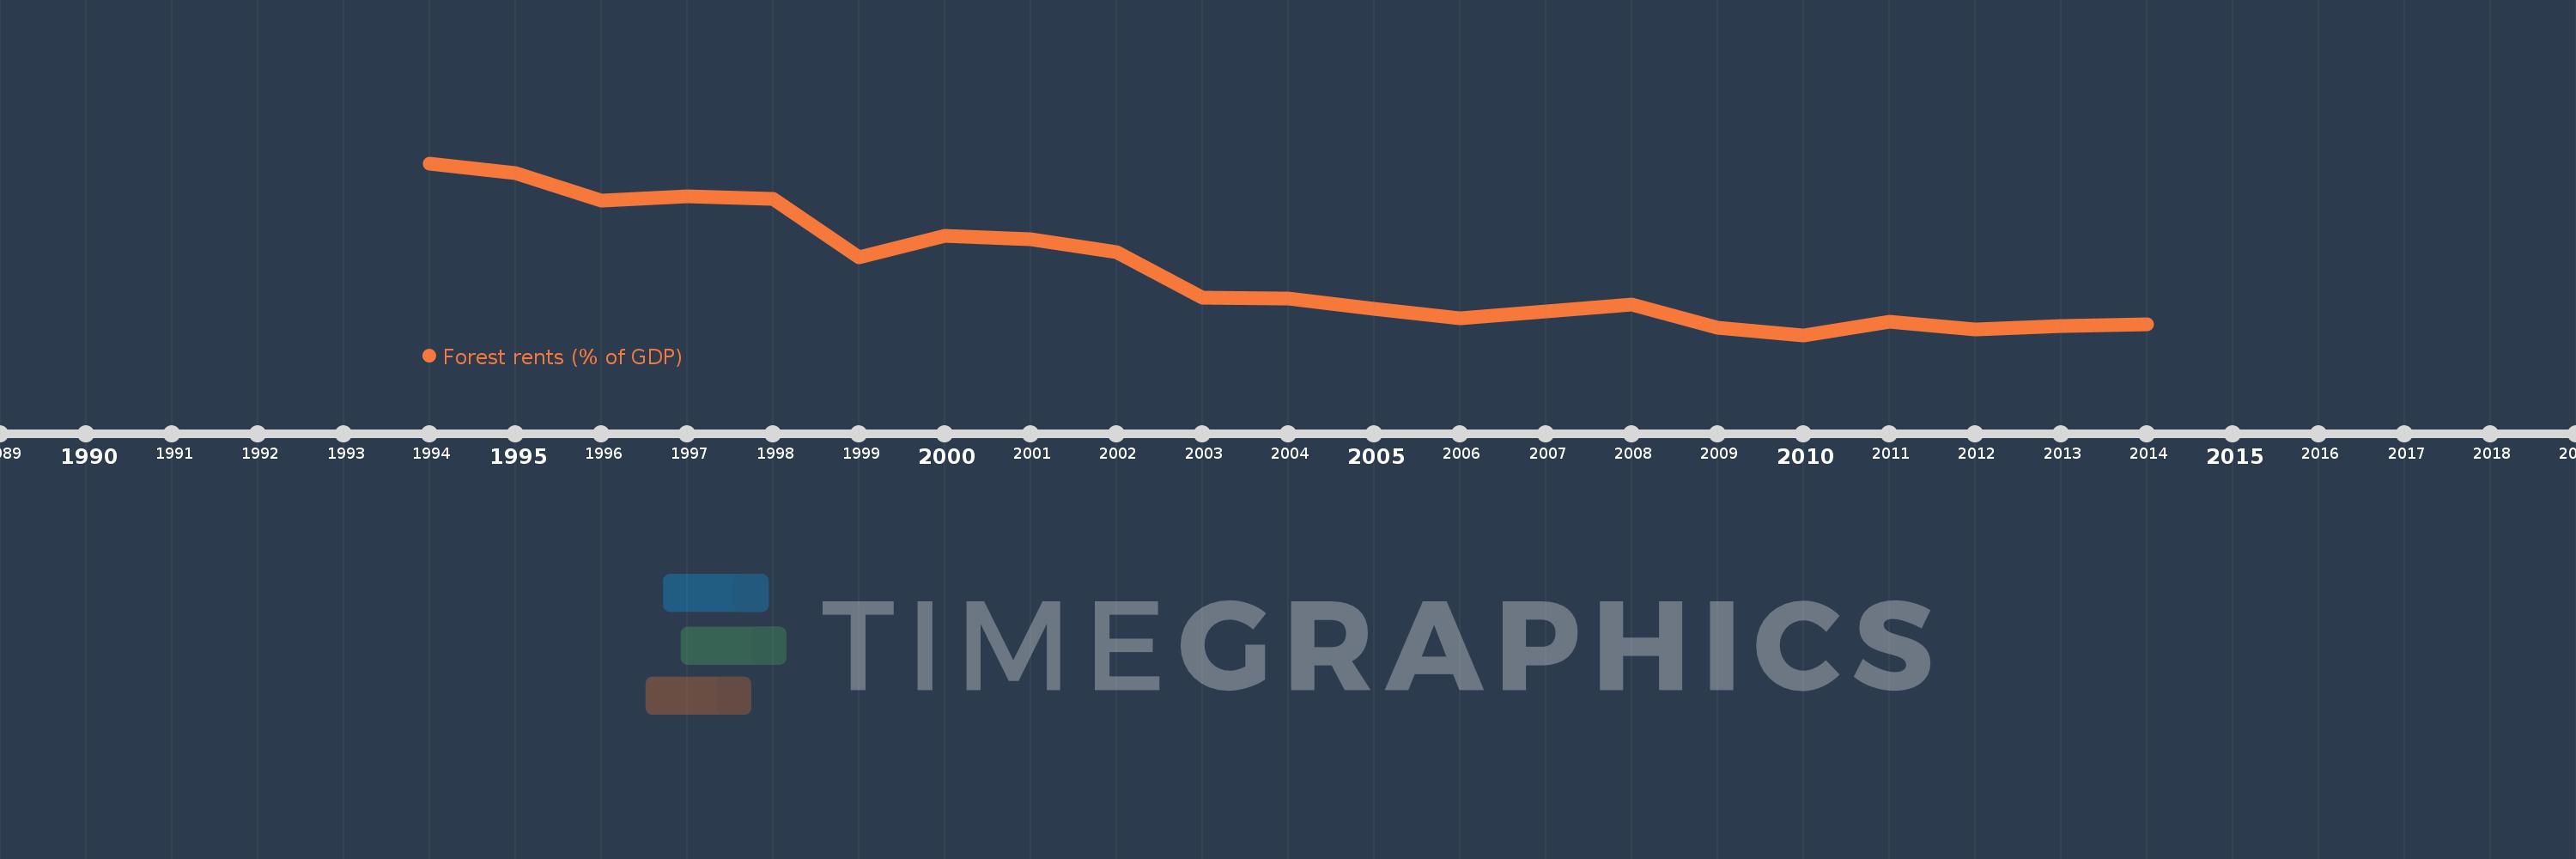
Nesta escala de tempo está apresentado um gráfico de 1994 ano até 2014 ano Czech Republic. Dados de 1993 ano ausente. O número de observações reais por data: 21.

Fonte (nome):

Indicadores de desenvolvimento mundial

Fonte (organização):

Estimates based on sources and methods described in "The Changing Wealth of Nations: Measuring Sustainable Development in the New Millennium" (World Bank, 2011).

Categorias:

Environment

Foi atualizado:

23 abr 2017 ano

Indicadores de alterações dos valores ao longo dos anos

Em média:
0.253
Mínimo:
0.145
1 jan 2010 ano
Máximo:
0.442
1 jan 1994 ano
Na data de observação
Valor
Mudança absoluta
A alteração em relação ao valor anterior
1 jan 1994 ano
0.442
+0.442
0.0%
1 jan 1995 ano
0.425
-0.017
-3.85%
1 jan 1996 ano
0.377
-0.048
-11.2%
1 jan 1997 ano
0.385
+0.008
2.03%
1 jan 1998 ano
0.38
-0.005
-1.29%
1 jan 1999 ano
0.279
-0.101
-26.57%
1 jan 2000 ano
0.316
+0.037
13.37%
1 jan 2001 ano
0.31
-0.006
-1.9%
1 jan 2002 ano
0.289
-0.022
-6.94%
1 jan 2003 ano
0.21
-0.079
-27.21%
1 jan 2004 ano
0.208
-0.002
-1.18%
1 jan 2005 ano
0.191
-0.017
-8.23%
1 jan 2006 ano
0.174
-0.017
-8.68%
1 jan 2007 ano
0.186
+0.012
7.0%
1 jan 2008 ano
0.197
+0.01
5.53%
1 jan 2009 ano
0.157
-0.039
-20.06%
1 jan 2010 ano
0.145
-0.013
-8.05%
1 jan 2011 ano
0.168
+0.023
15.9%
1 jan 2012 ano
0.155
-0.013
-7.78%
1 jan 2013 ano
0.161
+0.007
4.31%
1 jan 2014 ano
0.164
+0.002
1.43%

Classificação de países por estatísticas atuais por anos