33
/pt/
AIzaSyB4mHJ5NPEv-XzF7P6NDYXjlkCWaeKw5bc
November 1, 2025
115743
Cuba
CUB
true
2
1
Expenditure on tertiary as % of government expenditure on education (%)
2008,2007,2006,2005,2003,2002,2001,2000,1999
Create a timeline
Public Timelines
For education
For educational institutions
For teachers
For students
Cabinet
For educational institutions
For teachers
For students
Open cabinet
FAQ
Receber premium
Close
Create a timeline
Public timelines
FAQ
About & Feedback
Acordo
Privacidade
FAQ
Support 24/7
Cabinet
Get premium
Donate
Download
Biblioteca de estatísticas globais
→
Cuba
→
Expenditure on tertiary as % of government expenditure on education (%)
Estas estatísticas em outros países:
Albania
Algeria
American Samoa
Andorra
Angola
Antigua and Barbuda
Argentina
Armenia
Aruba
Australia
Austria
Azerbaijan
Bangladesh
Barbados
Belarus
Belgium
Belize
Benin
Bermuda
Bhutan
Bolivia
Botswana
Brazil
British Virgin Islands
Brunei Darussalam
Bulgaria
Burkina Faso
Burundi
Cabo Verde
Cambodia
Cameroon
Canada
Caribbean small states
Central African Republic
Central Europe and the Baltics
Chad
Chile
China
Colombia
Comoros
Congo, Dem. Rep.
Congo, Rep.
Costa Rica
Cote d'Ivoire
Croatia
Cuba
Curacao
Cyprus
Czech Republic
Denmark
Djibouti
Dominican Republic
East Asia & Pacific
East Asia & Pacific (excluding high income)
East Asia & Pacific (IDA & IBRD countries)
Ecuador
El Salvador
Equatorial Guinea
Eritrea
Estonia
Ethiopia
Euro area
Europe & Central Asia
Europe & Central Asia (excluding high income)
Europe & Central Asia (IDA & IBRD countries)
European Union
Fiji
Finland
France
Gabon
Gambia, The
Georgia
Germany
Ghana
Greece
Grenada
Guatemala
Guinea
Guinea-Bissau
Guyana
Heavily indebted poor countries (HIPC)
High income
Honduras
Hong Kong SAR, China
Hungary
IBRD only
Iceland
IDA & IBRD total
IDA blend
IDA only
IDA total
India
Indonesia
Iran, Islamic Rep.
Ireland
Israel
Italy
Jamaica
Japan
Jordan
Kazakhstan
Kenya
Korea, Rep.
Kuwait
Kyrgyz Republic
Lao PDR
Late-demographic dividend
Latin America & Caribbean
Latin America & Caribbean (excluding high income)
Latin America & the Caribbean (IDA & IBRD countries)
Latvia
Least developed countries: UN classification
Lebanon
Lesotho
Liberia
Libya
Liechtenstein
Lithuania
Low & middle income
Low income
Lower middle income
Macao SAR, China
Macedonia, FYR
Madagascar
Malawi
Malaysia
Maldives
Mali
Malta
Marshall Islands
Mauritania
Mauritius
Mexico
Middle income
Moldova
Monaco
Mongolia
Morocco
Mozambique
Namibia
Nepal
Netherlands
New Zealand
Nicaragua
Niger
North America
Norway
OECD members
Oman
Other small states
Pakistan
Palau
Panama
Paraguay
Peru
Philippines
Poland
Portugal
Post-demographic dividend
Pre-demographic dividend
Puerto Rico
Romania
Russian Federation
Rwanda
Samoa
San Marino
Sao Tome and Principe
Saudi Arabia
Senegal
Serbia
Seychelles
Sierra Leone
Singapore
Slovak Republic
Slovenia
Small states
South Africa
South Asia
South Asia (IDA & IBRD)
South Sudan
Spain
Sri Lanka
St. Kitts and Nevis
St. Lucia
St. Vincent and the Grenadines
Sub-Saharan Africa
Sub-Saharan Africa (excluding high income)
Sub-Saharan Africa (IDA & IBRD countries)
Swaziland
Sweden
Switzerland
Syrian Arab Republic
Tajikistan
Tanzania
Thailand
Timor-Leste
Togo
Tonga
Tunisia
Turkey
Turkmenistan
Turks and Caicos Islands
Uganda
Ukraine
United Kingdom
United States
Upper middle income
Uruguay
Vanuatu
Venezuela, RB
Vietnam
World
Zambia
Zimbabwe
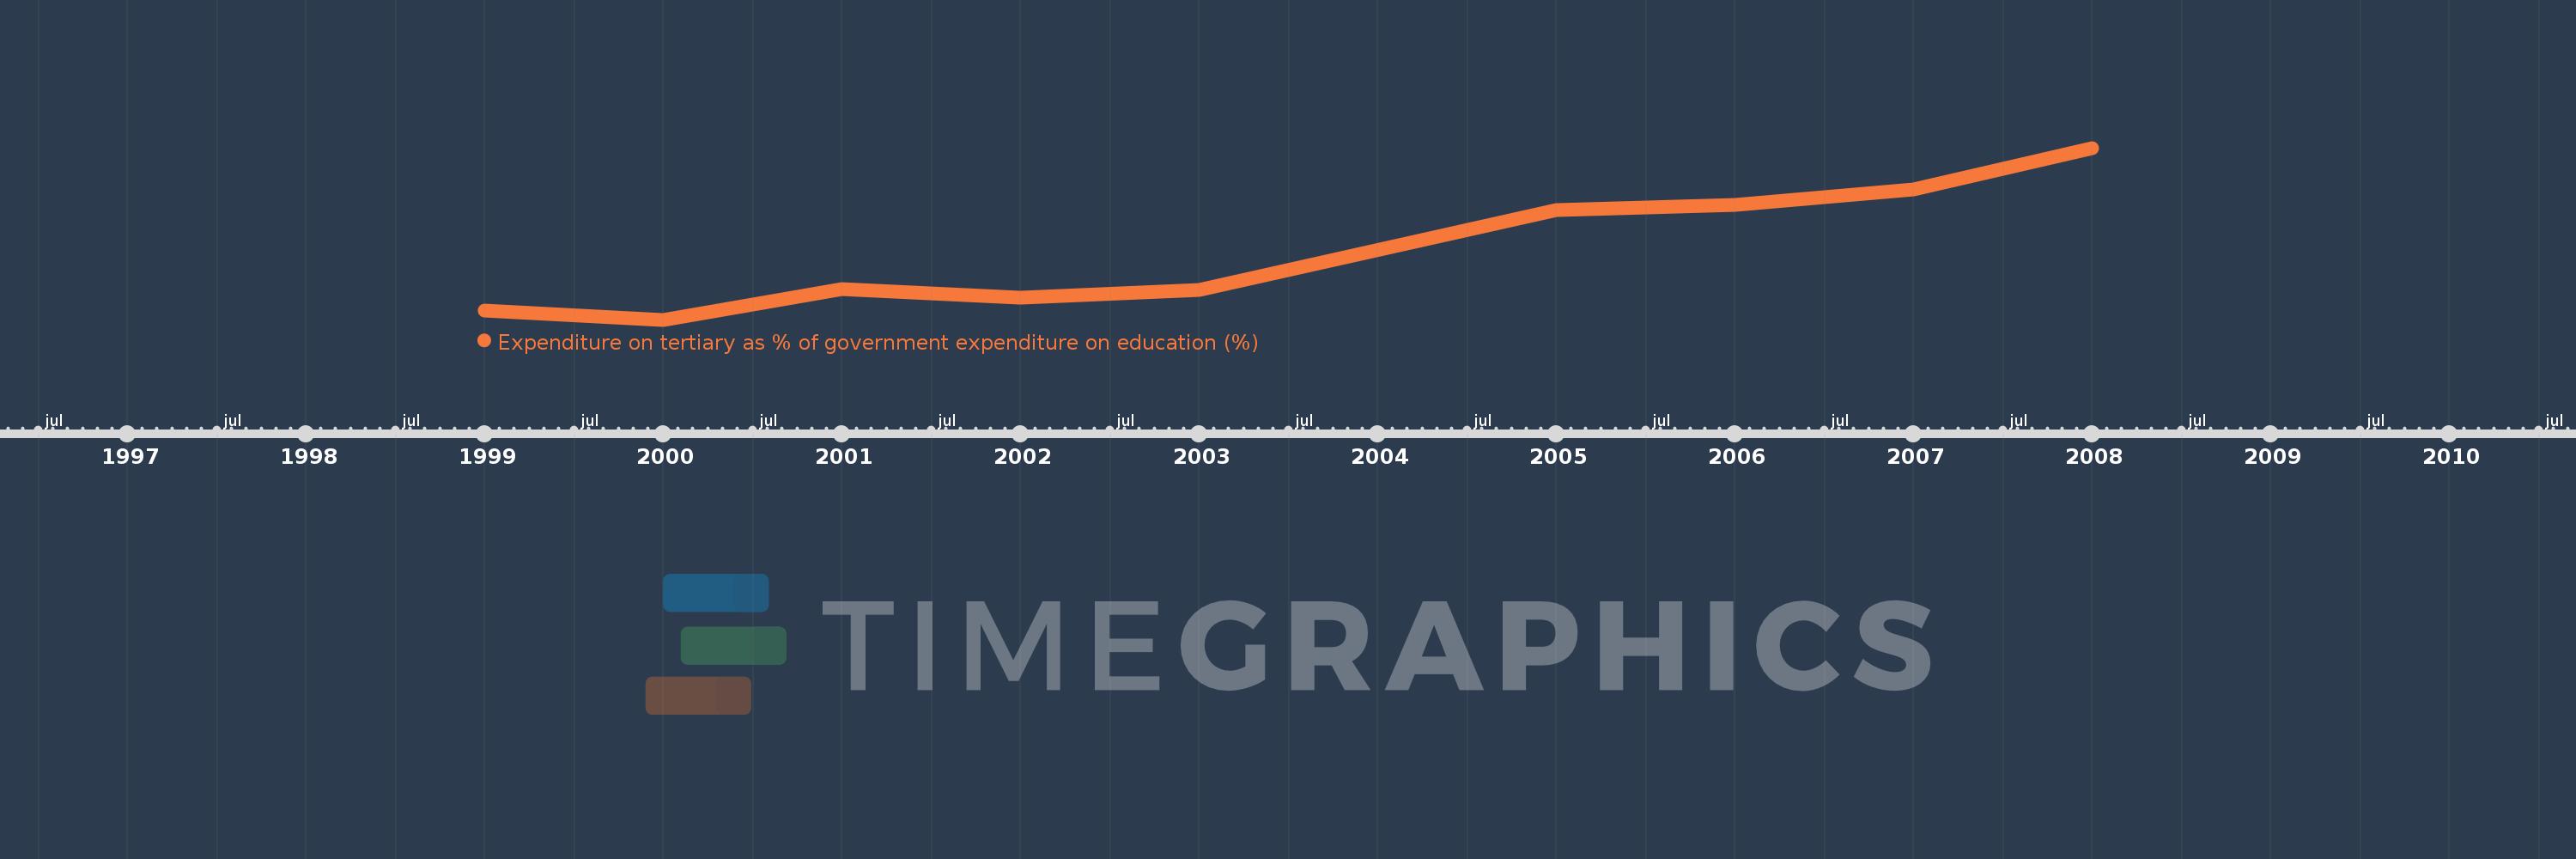
Linha do tempo:
Nesta escala de tempo está apresentado um gráfico de
1999
ano até
2008
ano Cuba. Dados de
1998
ano ausente. O número de observações reais por data:
9
.
Fonte (nome):
Indicadores de desenvolvimento mundial
Fonte (organização):
UNESCO Institute for Statistics
Categorias:
Education
Foi atualizado:
23 abr 2017 ano
Indicadores de alterações dos valores ao longo dos anos
Em média:
19.602
Mínimo:
15.922
1 jan 2000 ano
Máximo:
25.117
1 jan 2008 ano
Na data de observação
Valor
Mudança absoluta
A alteração em relação ao valor anterior
1 jan 1999 ano
16.434
+16.434
0.0%
1 jan 2000 ano
15.922
-0.511
-3.11%
1 jan 2001 ano
17.571
+1.649
10.36%
1 jan 2002 ano
17.105
-0.466
-2.65%
1 jan 2003 ano
17.539
+0.434
2.54%
1 jan 2005 ano
21.779
+4.24
24.18%
1 jan 2006 ano
22.061
+0.282
1.29%
1 jan 2007 ano
22.893
+0.832
3.77%
1 jan 2008 ano
25.117
+2.224
9.72%
Classificação de países por estatísticas atuais por anos
About & Feedback
Acordo
Privacidade
FAQ
Support 24/7
Cabinet
Get premium
Donate
The service accepts bank transfer (ACH, Wire) or cards (Visa, MasterCard, etc). Processed by Stripe.
Secured with SSL