33
/pt/
AIzaSyB4mHJ5NPEv-XzF7P6NDYXjlkCWaeKw5bc
November 30, 2025
103324
Chad
TCD
true
2
1
Borrowers from commercial banks (per 1,000 adults)
2016,2015,2014,2013,2012,2011,2009,2005
Create a timeline
Public Timelines
For education
For educational institutions
For teachers
For students
Cabinet
For educational institutions
For teachers
For students
Open cabinet
FAQ
Close
Create a timeline
Public timelines
FAQ
About & Feedback
Acordo
Privacidade
FAQ
Support 24/7
Cabinet
Get premium
Donate
Download
Biblioteca de estatísticas globais
→
Chad
→
Borrowers from commercial banks (per 1,000 adults)
Estas estatísticas em outros países:
Afghanistan
Albania
Algeria
Angola
Arab World
Argentina
Azerbaijan
Bangladesh
Belgium
Belize
Bolivia
Bosnia and Herzegovina
Botswana
Brazil
Brunei Darussalam
Burundi
Cabo Verde
Cameroon
Central African Republic
Central Europe and the Baltics
Chad
Chile
China
Colombia
Comoros
Congo, Dem. Rep.
Congo, Rep.
Costa Rica
Croatia
Djibouti
Dominican Republic
Early-demographic dividend
East Asia & Pacific (excluding high income)
East Asia & Pacific (IDA & IBRD countries)
Ecuador
Egypt, Arab Rep.
El Salvador
Equatorial Guinea
Estonia
Ethiopia
Europe & Central Asia (excluding high income)
Europe & Central Asia (IDA & IBRD countries)
Fragile and conflict affected situations
Gabon
Georgia
Ghana
Guatemala
Guinea
Haiti
Heavily indebted poor countries (HIPC)
Honduras
Hungary
IBRD only
IDA & IBRD total
IDA blend
IDA only
IDA total
Indonesia
Israel
Italy
Kenya
Kiribati
Kosovo
Kuwait
Kyrgyz Republic
Lao PDR
Late-demographic dividend
Latin America & Caribbean
Latin America & Caribbean (excluding high income)
Latin America & the Caribbean (IDA & IBRD countries)
Latvia
Least developed countries: UN classification
Lebanon
Lesotho
Liberia
Libya
Low & middle income
Low income
Lower middle income
Macedonia, FYR
Madagascar
Malawi
Malaysia
Maldives
Mauritania
Middle East & North Africa
Middle East & North Africa (excluding high income)
Middle East & North Africa (IDA & IBRD countries)
Middle income
Moldova
Montenegro
Mozambique
Myanmar
Namibia
Nigeria
Other small states
Pakistan
Palau
Paraguay
Peru
Poland
Portugal
Pre-demographic dividend
Qatar
Romania
Rwanda
Samoa
San Marino
Sao Tome and Principe
Saudi Arabia
Serbia
Seychelles
Sierra Leone
Singapore
Small states
Solomon Islands
South Asia
South Asia (IDA & IBRD)
South Sudan
Sub-Saharan Africa
Sub-Saharan Africa (excluding high income)
Sub-Saharan Africa (IDA & IBRD countries)
Suriname
Swaziland
Syrian Arab Republic
Tajikistan
Tanzania
Thailand
Timor-Leste
Tunisia
Turkey
Uganda
United Kingdom
Upper middle income
Uruguay
Uzbekistan
Vanuatu
West Bank and Gaza
World
Yemen, Rep.
Zambia
Zimbabwe
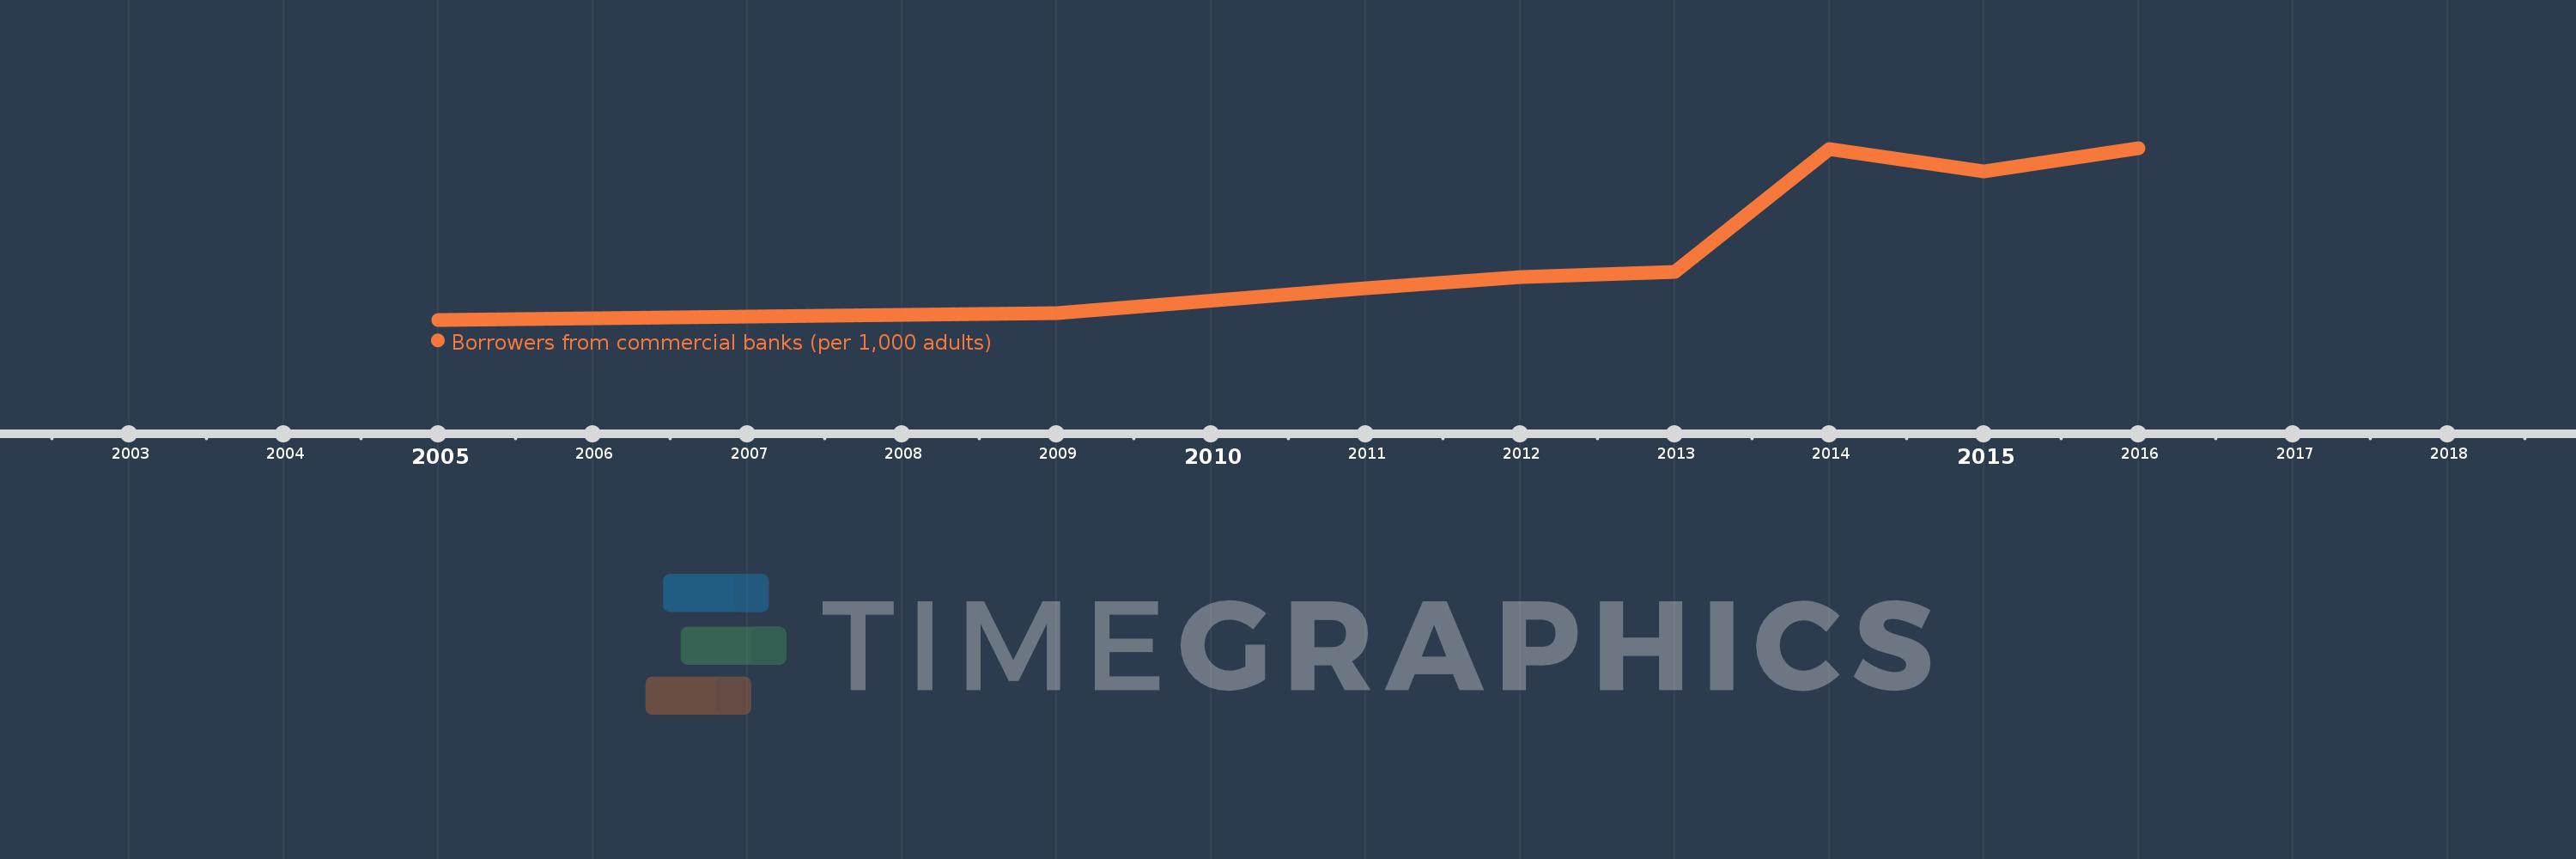
Linha do tempo:
Nesta escala de tempo está apresentado um gráfico de
2005
ano até
2016
ano Chad. Dados de
2004
ano ausente. O número de observações reais por data:
8
.
Fonte (nome):
Indicadores de desenvolvimento mundial
Fonte (organização):
International Monetary Fund, Financial Access Survey.
Categorias:
Financial Sector
Foi atualizado:
23 abr 2017 ano
Indicadores de alterações dos valores ao longo dos anos
Em média:
4.788
Mínimo:
0.378
1 jan 2005 ano
Máximo:
10.166
1 jan 2016 ano
Na data de observação
Valor
Mudança absoluta
A alteração em relação ao valor anterior
1 jan 2005 ano
0.378
+0.378
0.0%
1 jan 2009 ano
0.763
+0.386
102.04%
1 jan 2011 ano
2.195
+1.432
187.55%
1 jan 2012 ano
2.787
+0.591
26.94%
1 jan 2013 ano
3.106
+0.32
11.48%
1 jan 2014 ano
10.094
+6.987
224.94%
1 jan 2015 ano
8.813
-1.281
-12.69%
1 jan 2016 ano
10.166
+1.354
15.36%
Classificação de países por estatísticas atuais por anos
About & Feedback
Acordo
Privacidade
FAQ
Support 24/7
Cabinet
Get premium
Donate
The service accepts bank transfer (ACH, Wire) or cards (Visa, MasterCard, etc). Processed by Stripe.
Secured with SSL