Bonnie Thesis
Category: Altro
è stato aggiornato: 4 giu 2021
Understanding the Urban Metabolism - @Bonnie_0000
Autori

Created byBoyana B
Attachments
Eventi
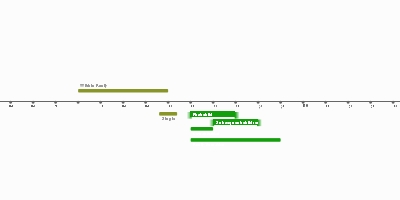
27th March29th April21th April5th April25th AprilCensus 1971Census 1981Census 1991Census 2001Census 201119662011LS Sample:
Base Geography*: 1971 Wards
N = 427 358
N (M1) = 49 634LS Sample:
Base Geography*: 1981 Wards
N = 435 734
N (M1) = 40 254LS Sample:
Base Geography*: 1991 Wards
N = 338 555
N (M1) = 24 144LS Sample:
Base Geography*: 2001 OAs
N = 389 561
N (M1) = 39 616LS Sample:
Base Geography*: 2011 OAs
N = 301 804
N (M1) = 17 716Periodi
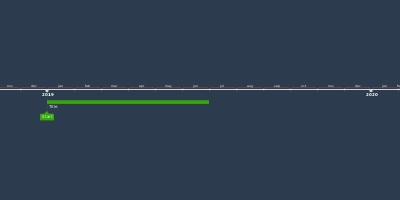
Move One Year AgoMove One Year AgoMove One Year AgoHouse Price Small Area Stats (HPSAA)Move One Year AgoMoved 1yrs Ago?HPASS: Sales ConsideredHPASS: Sales ConsideredHouse PriceHouse PriceMoved 5yrs Ago?Development-Level DataG0: Greatest GenerationG1: Silent GenerationG2: Baby BoomersG3: Generation XG4: MillenialsG5: Generation ZG6: Generation Alpha
Comments