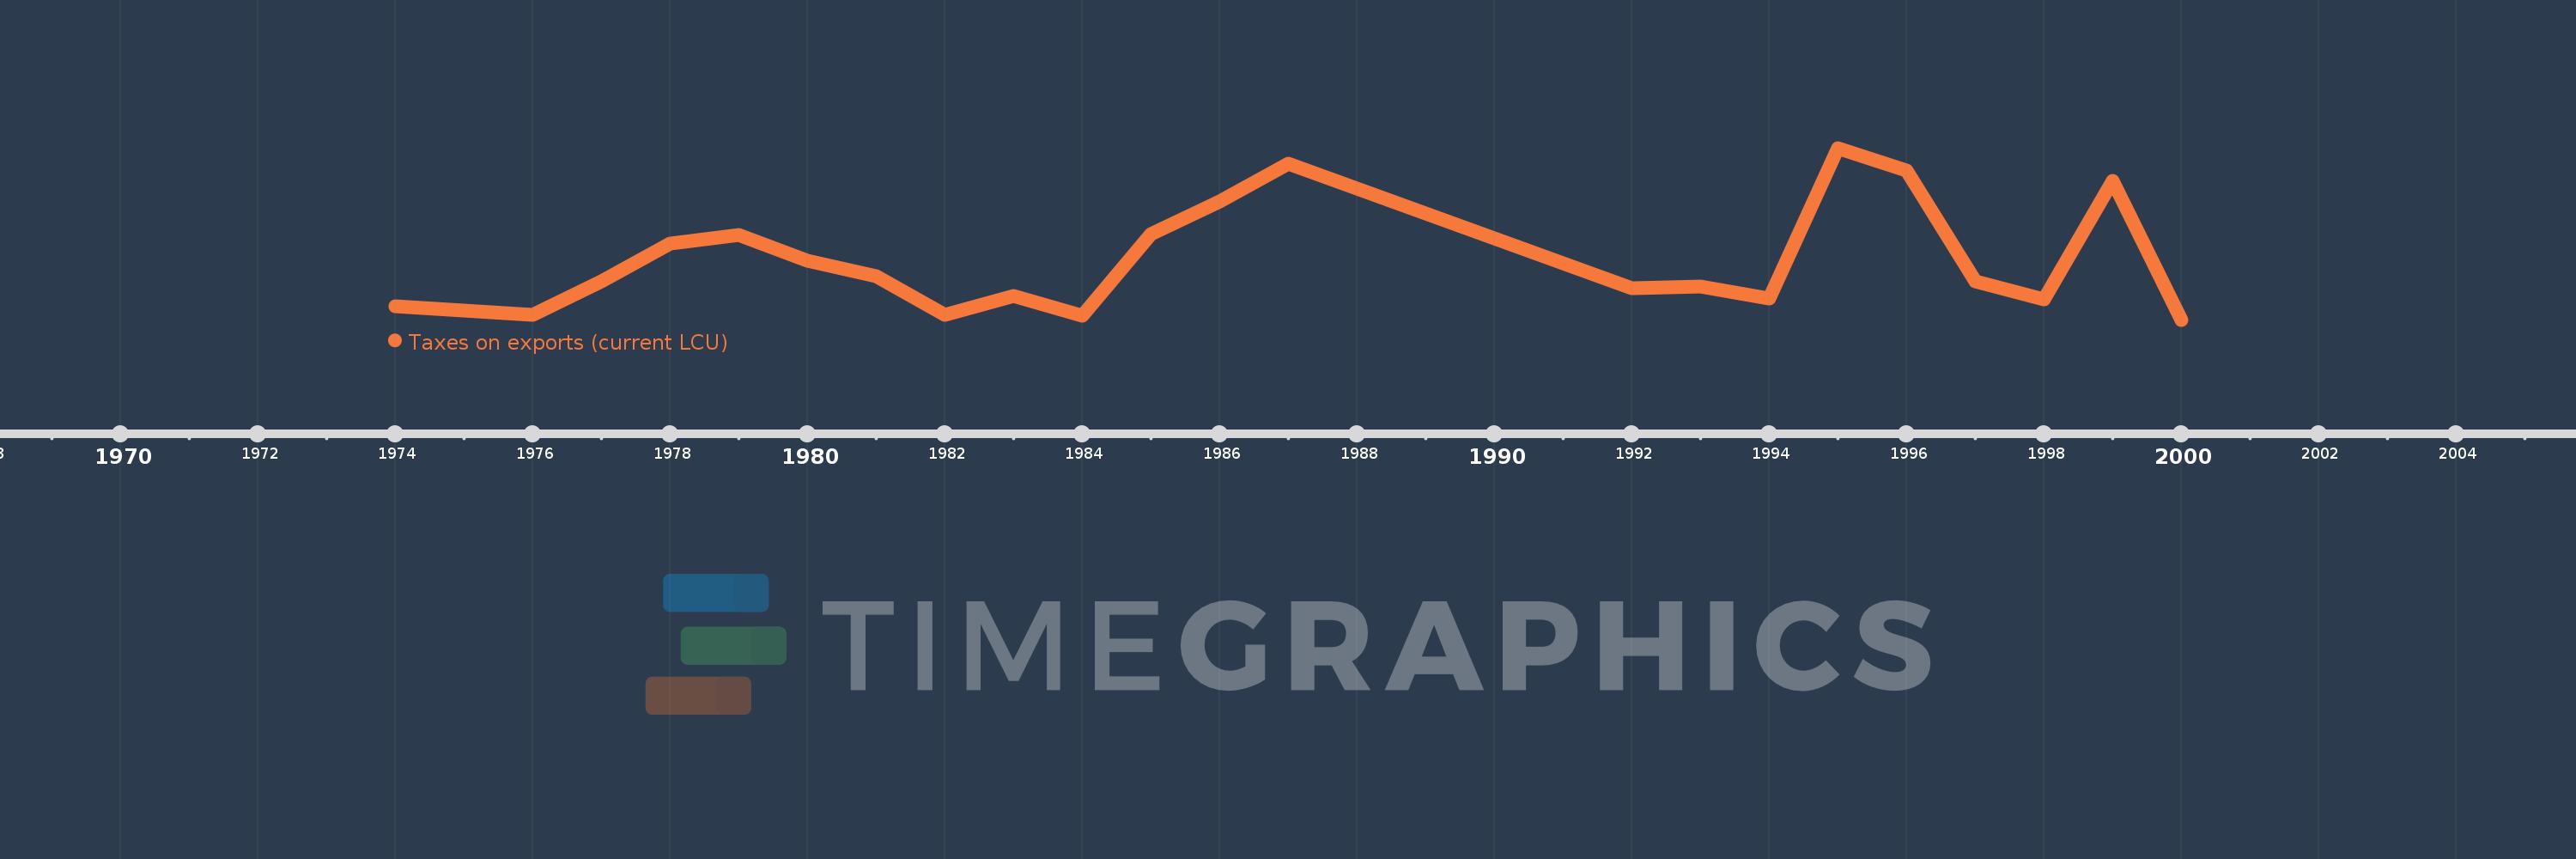
Cette échelle de temps montre un graphique de 1974 année à 2000 année Burundi. Les données jusqu'à 1973 année ne sont pas présentés. Quantité d'observations actuelles selon dates: 23.
Source (désignation):
Les indicateurs du développement mondiale
Source (organisation):
International Monetary Fund, Government Finance Statistics Yearbook and data files.
Catégories:
Public Sector
Dernière mise à jour
23 avr. 2017
Les indicateurs de changement de valeurs selon les années
En moyenne:
1.917 mds
Minimum:
28.4 mln.
1 janv. 2000
Maximum:
5.652 mds
1 janv. 1995
Pour la date d''observation
Valeur
Changement absolu
Le changement par rapport à la valeur précédente
1 janv. 1974
457.0 mln.
+457.0 mln.
0.0%
1 janv. 1975
331.0 mln.
-126.0 mln.
-27.57%
1 janv. 1976
178.0 mln.
-153.0 mln.
-46.22%
1 janv. 1977
1.294 mds
+1.116 mds
626.97%
1 janv. 1978
2.519 mds
+1.225 mds
94.67%
1 janv. 1979
2.803 mds
+284.0 mln.
11.27%
1 janv. 1980
1.967 mds
-836.0 mln.
-29.83%
1 janv. 1981
1.456 mds
-511.0 mln.
-25.98%
1 janv. 1982
179.0 mln.
-1.277 mds
-87.71%
1 janv. 1983
816.0 mln.
+637.0 mln.
355.87%
1 janv. 1984
147.0 mln.
-669.0 mln.
-81.99%
1 janv. 1985
2.835 mds
+2.688 mds
1.83 milles%
1 janv. 1986
3.909 mds
+1.074 mds
37.88%
1 janv. 1987
5.143 mds
+1.234 mds
31.57%
1 janv. 1992
1.074 mds
-4.069 mds
-79.12%
1 janv. 1993
1.106 mds
+32.0 mln.
2.98%
1 janv. 1994
716.0 mln.
-390.0 mln.
-35.26%
1 janv. 1995
5.652 mds
+4.936 mds
689.39%
1 janv. 1996
4.919 mds
-733.0 mln.
-12.97%
1 janv. 1997
1.298 mds
-3.621 mds
-73.61%
1 janv. 1998
702.0 mln.
-596.0 mln.
-45.92%
1 janv. 1999
4.562 mds
+3.86 mds
549.84%
1 janv. 2000
28.4 mln.
-4.534 mds
-99.38%
Classement des pays selon les statistiques actuelles par années