33
/fr/
AIzaSyB4mHJ5NPEv-XzF7P6NDYXjlkCWaeKw5bc
November 30, 2025
95877
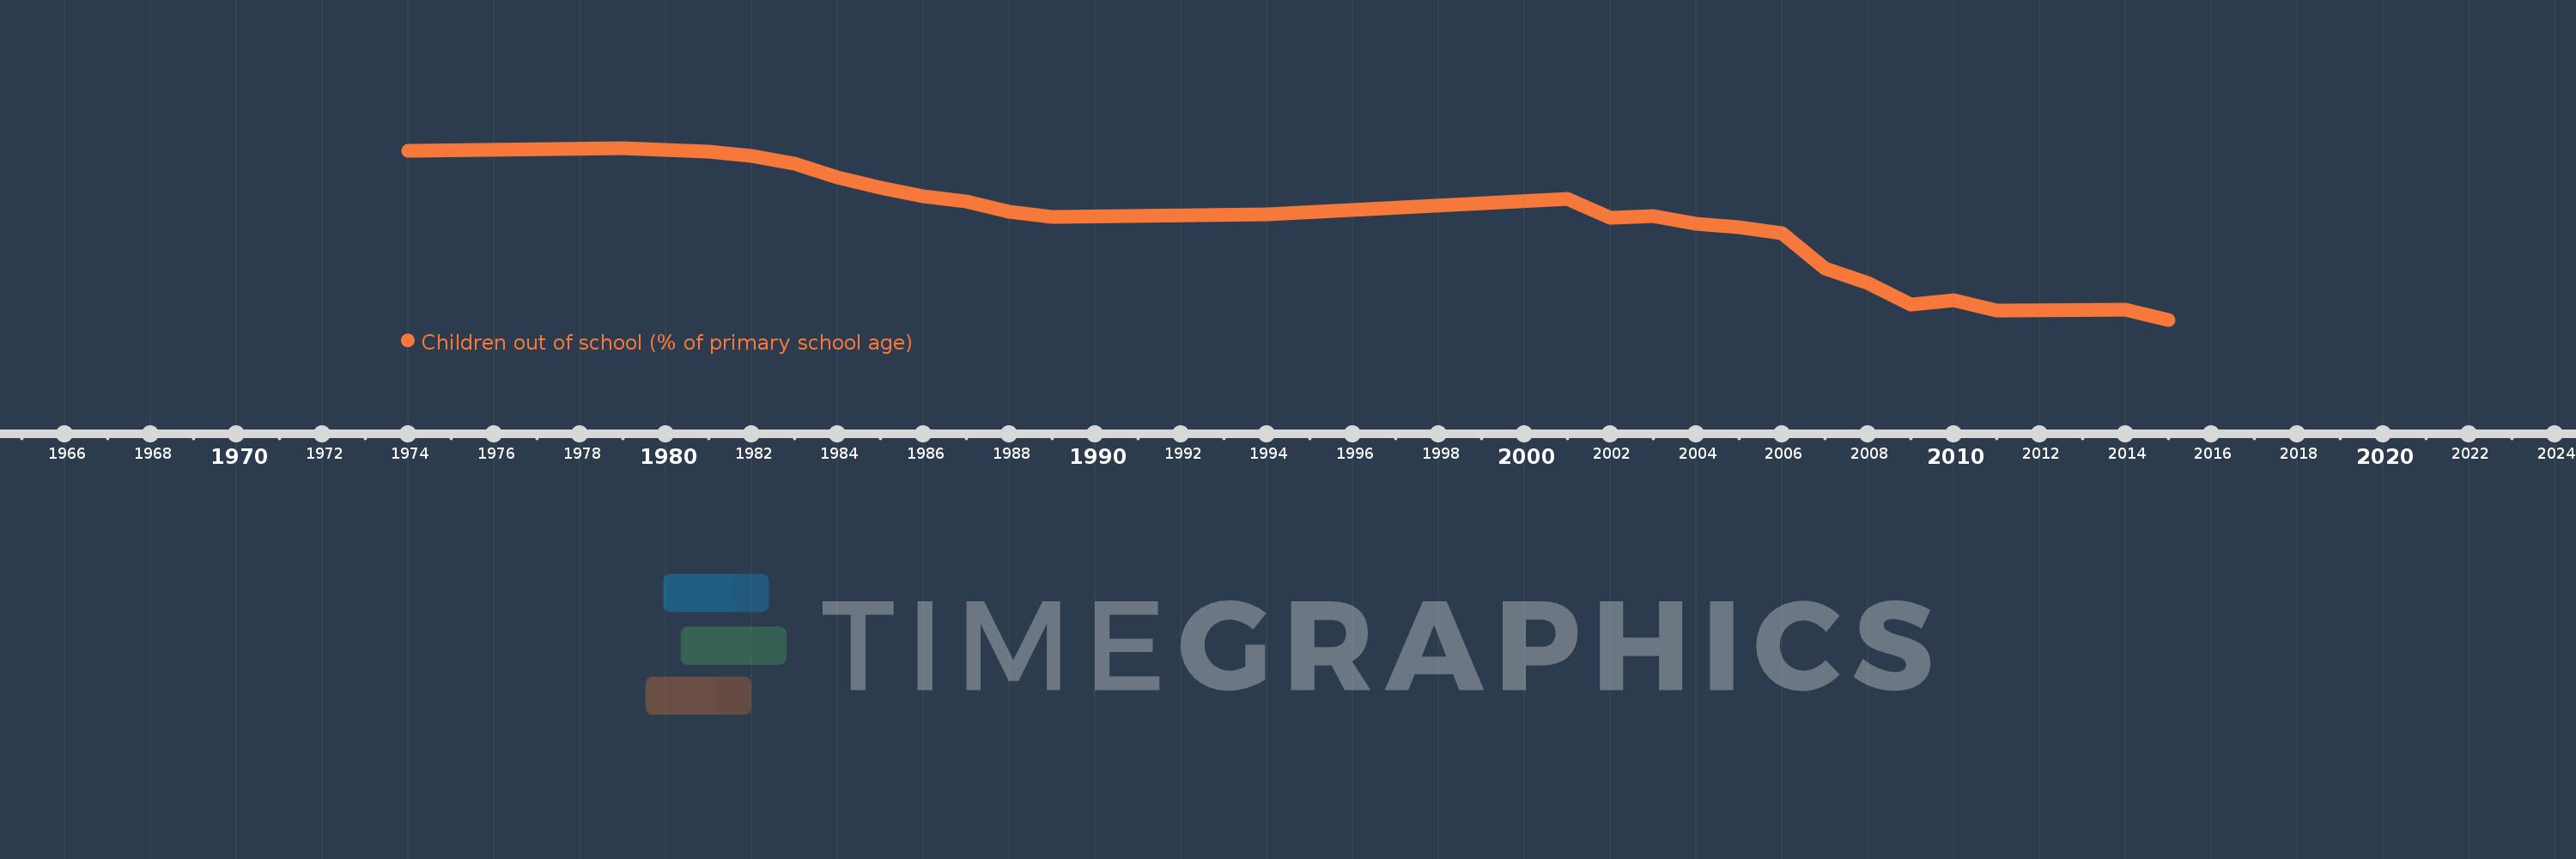
Burundi
BDI
true
2
1
Children out of school (% of primary school age)
2015,2014,2011,2010,2009,2008,2007,2006,2005,2004,2003,2002,2001,1994,1989,1988,1987,1986,1985,1984,1983,1982,1981,1979,1974