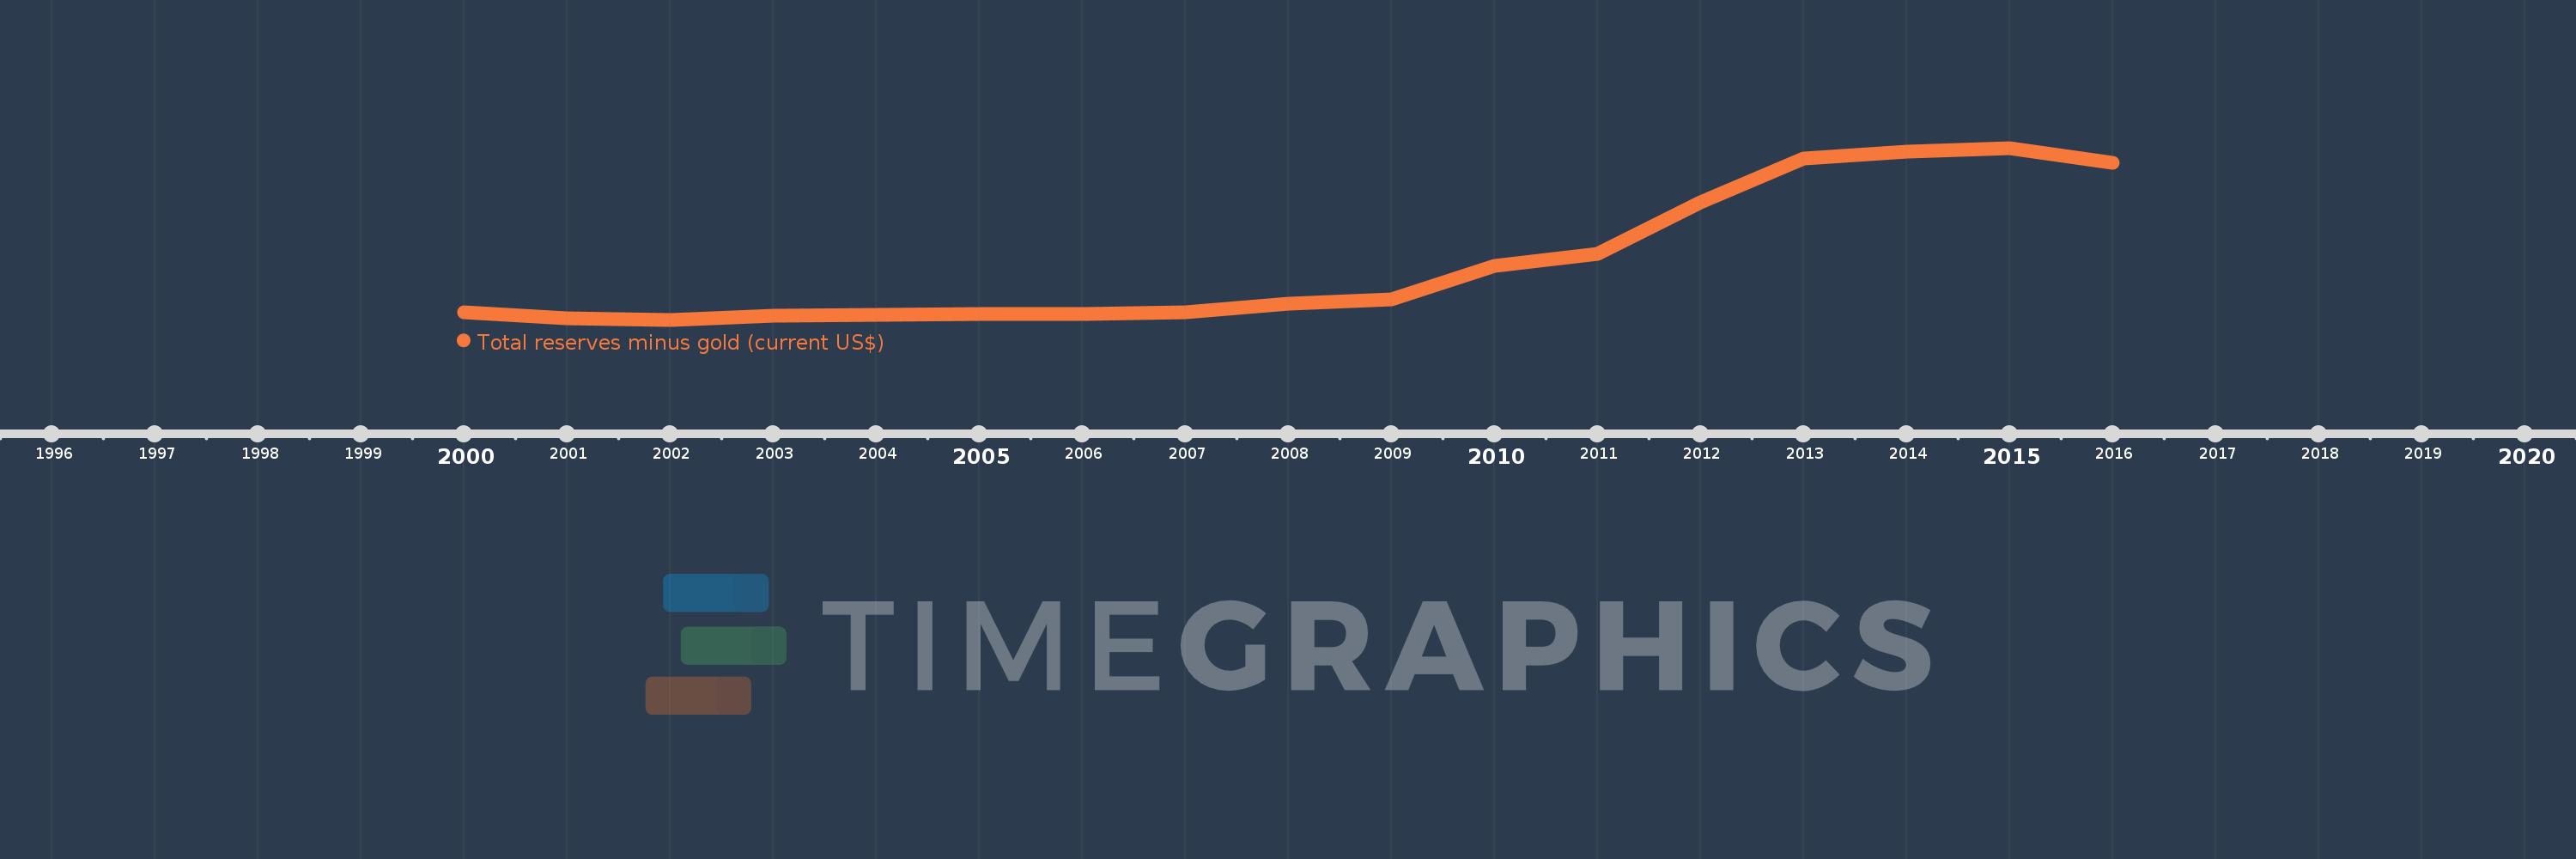
Cette échelle de temps montre un graphique de 2000 année à 2016 année Brunei Darussalam. Les données jusqu'à 1999 année ne sont pas présentés. Quantité d'observations actuelles selon dates: 17.
Source (désignation):
Les indicateurs du développement mondiale
Source (organisation):
International Monetary Fund, International Financial Statistics and data files.
Catégories:
Economy & Growth, Financial Sector
Dernière mise à jour
23 avr. 2017
Les indicateurs de changement de valeurs selon les années
En moyenne:
1.407 mds
Minimum:
381.821 mln.
1 janv. 2002
Maximum:
3.471 mds
1 janv. 2015
Pour la date d''observation
Valeur
Changement absolu
Le changement par rapport à la valeur précédente
1 janv. 2000
516.845 mln.
+516.845 mln.
0.0%
1 janv. 2001
408.341 mln.
-108.504 mln.
-20.99%
1 janv. 2002
381.821 mln.
-26.519 mln.
-6.49%
1 janv. 2003
448.994 mln.
+67.173 mln.
17.59%
1 janv. 2004
474.743 mln.
+25.75 mln.
5.73%
1 janv. 2005
488.89 mln.
+14.146 mln.
2.98%
1 janv. 2006
491.885 mln.
+2.996 mln.
0.61%
1 janv. 2007
513.57 mln.
+21.685 mln.
4.41%
1 janv. 2008
667.491 mln.
+153.921 mln.
29.97%
1 janv. 2009
751.16 mln.
+83.668 mln.
12.53%
1 janv. 2010
1.357 mds
+606.109 mln.
80.69%
1 janv. 2011
1.563 mds
+205.893 mln.
15.17%
1 janv. 2012
2.487 mds
+923.622 mln.
59.09%
1 janv. 2013
3.285 mds
+798.531 mln.
32.11%
1 janv. 2014
3.399 mds
+113.203 mln.
3.45%
1 janv. 2015
3.471 mds
+72.708 mln.
2.14%
1 janv. 2016
3.211 mds
-259.87 mln.
-7.49%
Classement des pays selon les statistiques actuelles par années